


Predicting Juan Soto's Upcoming Contract
How large of a megacontract starting in 2025 makes sense for Soto?

Between now and the trade deadline at the end of July, I plan to post daily articles looking at LEAFS projections for rumored and completed trades, and potential free agents at the end of the season. I’ll be turning on paid subscriptions shortly and offering a couple of other ways to support this site in the near future, and your contributions will greatly help me to continue developing and publishing high-quality baseball content.
I'm going to begin with Juan Soto, who will hit free agency at the end of this season and is anticipated to receive a megacontract. I'd be surprised if contract isn't for 8+ years and several hundred million dollars, so I've used LEAFS to predict Soto's stats from 2025-2036. These stats assume that Soto is playing in a neutral park, so they may be a bit higher or lower depending on where Soto signs his new contract. If you're not familiar with how LEAFS works, I encourage you to read my explanation of how the system works. I've run 5,000 simulations to provide a range of possible trajectories for Soto's career. These are based on an expected 650 plate appearances in each season, and the results you see here assume that Soto is playing in a neutral park.
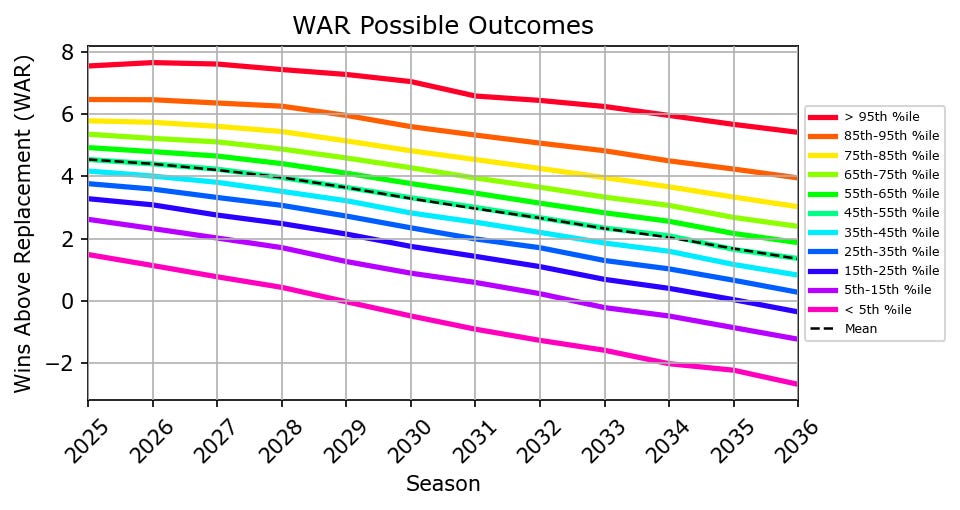
I'll begin with the average of the 45th-55th percentiles for Soto's production in each season. This is roughly the median of the projections for each season.
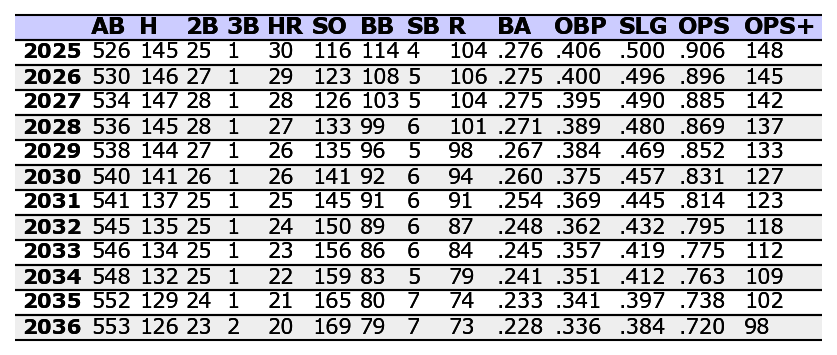
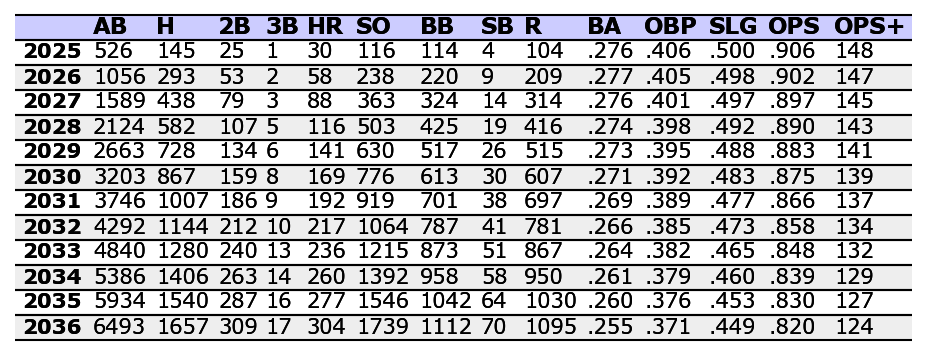
These predictions show that Soto is more likely than not to have above league average production through at least 2035. Here are his accumulated totals starting with the 2025 season, also in the 45th-55th percentile.
Comparable Players
According to Baseball Reference, the most similar batters to Soto through age 24 are Bryce Harper, Frank Robinson, Andruw Jones, Giancarlo Stanton, Mike Trout, Ken Griffey Jr., Juan González, Orlando Cepeda, Miguel Cabrera, and Eddie Mathews. I don't consider Jones to be a particularly good comparison because his rate of production (e.g., OPS and OPS+) never approached Soto's. My initial reaction upon looking at the comparisons was that the predictions were too pessimistic. LEAFS and many other prediction systems will generally perform best for average players because there is a much larger sample of average players, and far fewer exceptional players like Soto. That's just a result of having a lot more average players in the data set than exceptional ones.
The best players tend to have later peaks in their best production, an example of which is Cabrera, whose best seasons were between the ages of 27-30. Other players seemed to have two distinct peaks in production. Mathews' best seasons were between the ages of 21-23, but he had a second peak roughly from ages 27-29. Robinson also had one peak from ages 24-26 and another at 30 and 31. But there are also players like Griffey, whose production peaked between the ages of 23-27, then appeared to be on the way down even before injuries hampered his career with the Reds. The main conclusion from these comparisons is that there are a range of possibilities for when a player whose early career was similar to Soto's might have their best offensive production, and there's sometimes not just a single peak. The LEAFS projections for Soto favor an earlier peak in production toward the ages of 25-26 instead of a later peak around 28-29.
Trout and Stanton are perhaps the most intriguing comparisons because of their recency and the partial availability of Statcast data, but are also difficult to draw conclusions from because injuries have cut into their production. Stanton generally hit the ball harder than either Trout or Soto, with a consistently higher exit velocity and percentage of hard hit balls. Trout's production was boosted by a high line drive rate, despite not hitting the ball hard as frequently as either Stanton or Soto. Soto's line drive rate falls below both Stanton and Trout. However, Soto's exit velocity, percentage of hard hit balls, and fly ball rate are all at career highs in 2024, so his increase in home runs this year is not surprising. Soto has generally been healthy, certainly more than Stanton to this point in his career, so this is a good sign. Defensively, Soto is much closer to Stanton than Trout, and his below average defense will cut into his value somewhat.
Stanton signed a megacontract with the Marlins worth $325 million over 2015-2027 with a team option for 2028. This contract could be considered a baseline for the type of contract Soto might receive, with a need to adjust it for how the economics of baseball have changed over the previous decade. More recently, Trout received a 12 year contract that runs from 2019-2030 worth $426.5 million, but Trout's production both in terms of OPS and WAR was significantly above Soto's production at the time when he signed that contract.
LEAFS Predictions for Soto
The biggest question is whether Soto's increase in exit velocity, hard hit balls, and fly ball rate this season will continue, if it's the result of the small sample size of roughly half a season, or if he will revert closer to his career averages. Soto's OPS+ so far this season is 176, but prior to this season was around 155. The question that teams will have to decide when negotiating with Soto is whether this season is the start of a peak in production that might last through his late 20s, or if that peak is earlier, and if Soto is already close to his best production. The LEAFS projections seem a bit too pessimistic to me, and I suspect that Soto's OPS+ is probably about 10-15 points too low over the next 2-3 seasons. As I explained in my introduction to LEAFS, these predictions do partially factor in the risk of injury, but Soto has generally been rather healthy early in his career. I generally expect higher end of these predictions, perhaps with a peak in production around the age of 27. Here are Soto's projected statistics for 2025.
As a quick reminder, this isn’t saying that Soto will almost certainly strike out 114-117 times or walk 112-117 times. There’s actually a lot more variability among the predictions, but walks and strikeouts don’t correlate well with Soto’s overall production.
Contract Value
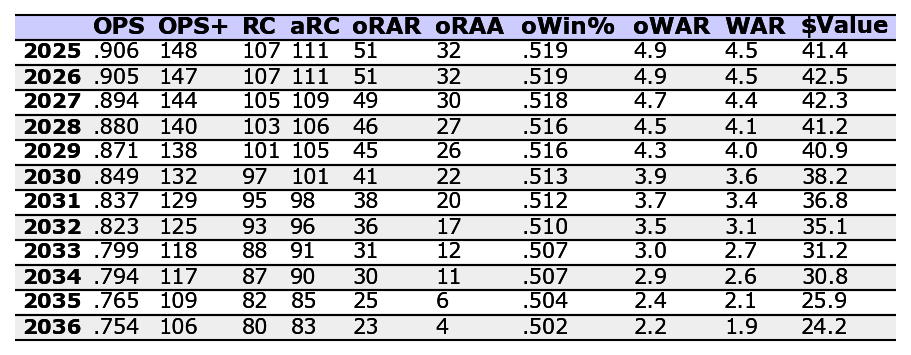
Assuming Soto is still approaching his peak, I'll use the 75th-85th percentiles for 2025 and 2026, then back it down to the 65th-75th percentiles for 2027-2029, and then the 55th-65th percentiles for 2030-2031. After that, I'll allow the predictions from 2032 onward to assume that Soto remains a bit healthier than normal. Here are the projected OPS+, oWAR, WAR, and production value for each of those seasons.
2025: OPS+: 166, oWAR: 6.1, WAR: 5.8, $Value: $52.7 million
2026: OPS+: 165, oWAR: 6.1, WAR: 5.7, $Value: $53.9 million
2027: OPS+: 155, oWAR: 5.4, WAR: 5.1, $Value: $49.4 million
2028: OPS+: 151, oWAR: 5.2, WAR: 4.9, $Value: $48.7 million
2029: OPS+: 146, oWAR: 4.9, WAR: 4.6, $Value: $47.1 million
2030: OPS+: 135, oWAR: 4.1, WAR: 3.8, $Value: $40.0 million
2031: OPS+: 130, oWAR: 3.8, WAR: 3.5, $Value: $37.7 million
2032: OPS+: 125, oWAR: 3.5, WAR: 3.1, $Value: $35.1 million
2033: OPS+: 118, oWAR: 3.0, WAR: 2.7, $Value: $31.2 million
2034: OPS+: 117, oWAR: 2.9, WAR: 2.6, $Value: $30.8 million
2035: OPS+: 109, oWAR: 2.4, WAR: 2.1, $Value: $25.9 million
2036: OPS+: 106, oWAR: 2.2, WAR: 1.9, $Value: $24.2 million
This is admittedly an optimistic projection in the sense that I'm assuming Soto is able to stay healthy and have 650 plate appearances in each season. It also exceeds the optimistic projections intended to represent if a player is healthier than average and avoids injuries that limit offensive production.
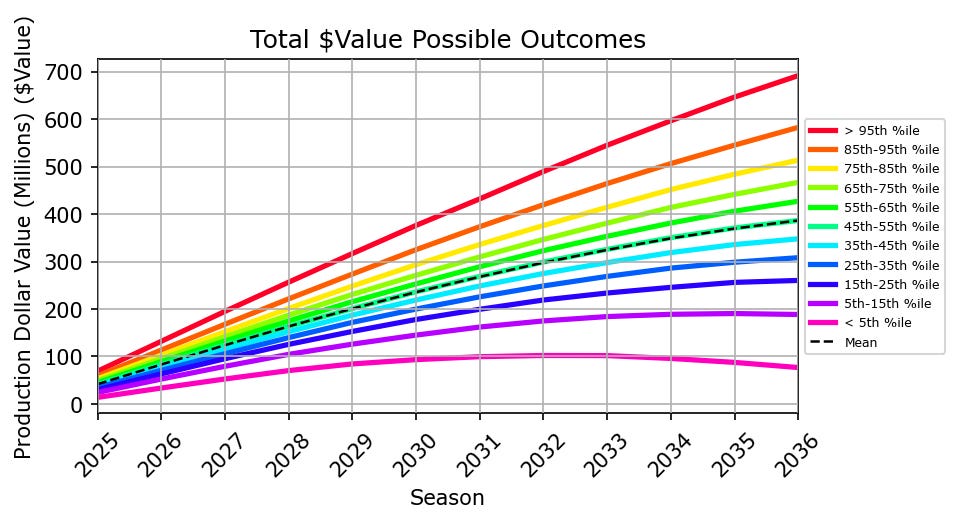
The value could be a bit higher in early seasons if Soto's peak production runs a couple of years longer or is a bit higher than what I'm predicting here. But it still runs above the median LEAFS prediction. Overall, I think it's a reasonable estimate of a reasonable value for a potential contract for Soto in free agency. Based on these numbers, here's the total value depending on the length of the contract.
2025: $Value: $52.7 million, Total: $52.7 million
2026: $Value: $53.9 million, Total: $106.6 million
2027: $Value: $49.4 million, Total: $156 million
2028: $Value: $48.7 million, Total: $204.7 million
2029: $Value: $47.1 million, Total: $251.8 million
2030: $Value: $40.0 million, Total: $291.8 million
2031: $Value: $37.7 million, Total: $329.5 million
2032: $Value: $35.1 million, Total: $364.6 million
2033: $Value: $31.2 million, Total: $395.8 million
2034: $Value: $30.8 million, Total: $426.6 million
2035: $Value: $25.9 million, Total: $452.5 million
2036: $Value: $24.2 million, Total: $476.7 million
One prediction reported on ESPN+ was that Soto could get a contract for 14 seasons worth $655 million. This is admittedly on the high end of the predictions in the article, but I also don't think many people anticipated Shohei Ohtani getting a 10 year contract worth $700 million. I only projected the next 12 seasons, but most of the value from Soto's production would occur in those seasons. That likely tracks somewhere around or slightly the 85th-95th percentiles, which would mean that Soto would probably need to average an OPS+ of almost 150 over the next 12 seasons. It's possible, yes, but it seems like a big risk to assume that when offering a contract. Even after stitching together these predictions to assume a later and longer peak in production and a slower decline, it's still below the level of production that would be needed to justify a 14 year contract for $655 million. These numbers are also a bit below the average value predicted for Soto’s contract in the ESPN+ article.
Potential Milestones
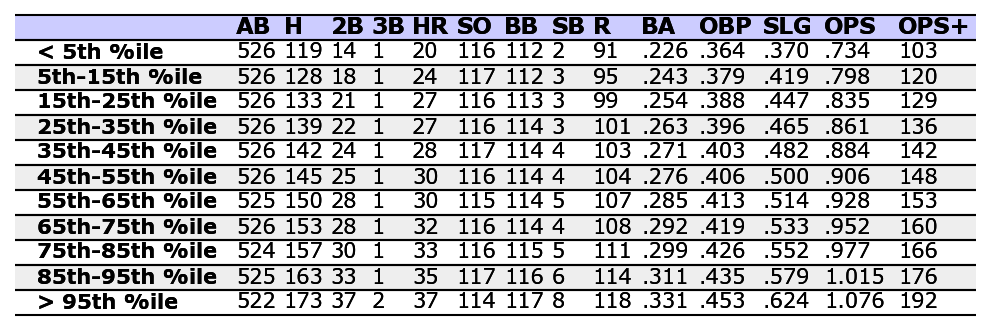
There is one other factor that might impact a player's value, which is milestones like 500 home runs or 3,000 hits. They don't have any extra value in terms of winning games, but they do generate fan interest, which could increase revenue from ticket sales and merchandise. That certainly has some value for a team financially. As a quick estimate, let's assume that Soto finishes the 2024 season with 36 home runs and 158 hits. That will give him 196 home runs and 926 hits for his career. Even with the > 95th percentile range, Soto isn't projected to get to 3,000 hits by 2036, though it is certainly possible if he plays after that.
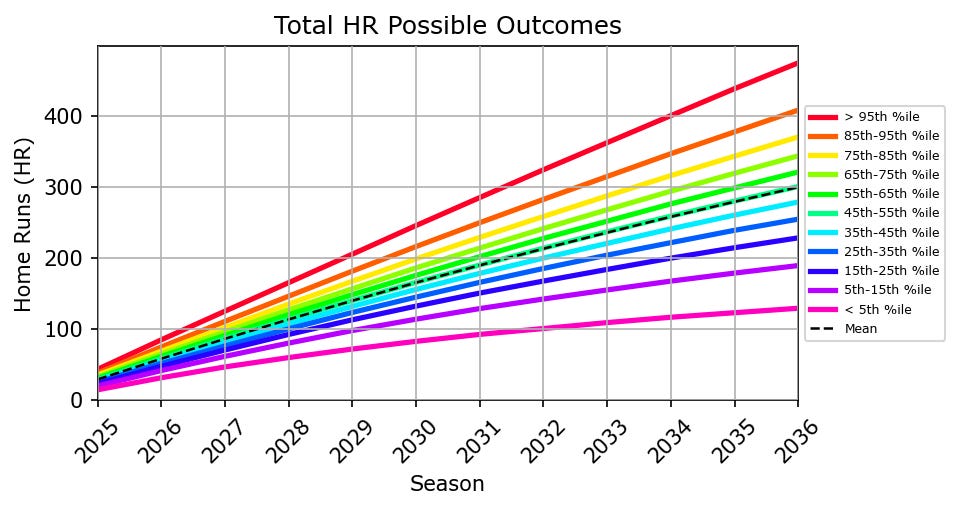
To reach 500 home runs, Soto would need 304 home runs, which is exactly the number projected for the 45th-55th percentiles in 2036. This suggests there's roughly a 50% chance using the raw projections that Soto would to 500 home runs during a 12 year contact. Here are what the numbers show for the various percentile ranges.
< 45th percentile: After 2036
45th-55th percentiles: During 2036, finishes 2036 with 500 home runs
55th-65th percentiles: During 2036, finishes 2036 with 511 home runs
65th-75th percentiles: During 2035, finishes 2035 with 506 home runs
75th-85th percentiles: During 2034, finishes 2034 with 500 home runs
85th-95th percentiles: During 2034, finishes 2034 with 523 home runs
> 95th percentile: During 2033, finishes 2033 with 527 home runs
Using the scenario I stitched together previously, Soto would reach 500 home runs in 2035 and finish that season with 506 home runs. If a team wants at least an average chance that Soto will hit his 500th home run while playing for them, they would probably need to sign Soto for an 11 or 12 year contract. For completeness, I should mention that Soto's 600th home run is in reach in 2036, but only with the > 95th percentile range, and he would finish the season with 636 home runs. This is not a likely scenario, but 500 home runs is within reach by 2036.
Summary
If I were a GM, I think it would be reasonable to offer 8 years at $365 million, 10 years at $425 million, or 12 years at $475 million. Even if I chose a more optimistic prediction and just followed the 75th-85th percentiles out to 2036, that still comes in well below the value of the $655 million megacontract. Even the valuation for the 75th-85th percentiles doesn't leave as much potential upside, while also shifting even more risk to the team if Soto doesn't produce at that level. If we revisit the player comparisons from the beginning of the article, Robinson certainly would have exceeded these projections, and Cabrera would have been above them as well. But even Cabrera eventually experienced a steep decline in production because of age and injuries. I fully expect Soto to get a bigger contract than what I've proposed here, and perhaps it'll work out quite well, but there's also a lot of risk that the team won't get the production they're paying for.
If you’d like to read more high-quality baseball content like a detailed look at the contract Soto might receive in free agency, be sure to subscribe so you can get more content from The Linked Letters delivered to your inbox.
Statistics cited in this article are sourced from Baseball Reference, Fangraphs, and Retrosheet. If you’d like to read more baseball-related content like this, please consider subscribing. You can also help The Linked Letters grow by sharing articles on social media. I plan to accept paid subscriptions in the near future.