


The LEAFS Forecast System for Predicting Future MLB Statistics
A look at how LEAFS predicts MLB player performance, the potential upside and downside for players, and the future value of a player's production


Please consider subscribing to The Linked Letters and sharing content on social media. Between now and the trade deadline, I'm planning to post almost daily articles analyzing trade rumors, deals that are completed, and free agent decisions at the end of the season. I’ll be turning on paid subscriptions shortly and offering a couple of other ways to support this site in the near future, and your contributions will greatly help me to continue developing and publishing high-quality baseball content.
Back in March, I posted a few articles about predictions for this season using a system that I'd developed to forecast a player and team statistics in the upcoming season. Since that time, I've overhauled many parts of the system to make it more efficient, easier and simpler to run, and most importantly to improve the quality of the predictions it makes. Although my new forecasting system uses many of the same principles as the old one, most of the software has been rewritten to the point that I consider it a new system.
I'd like to introduce LEAFS version 1, which I'll be using in my analysis. I'm not good at thinking of names and acronyms for software tools and systems, but I feel like I need a name for this prediction system, and I decided on LEAFS. It's an acronym for Linked letters Ensemble-based Automated Forecasting System. The ensemble-based part of the acronym refers to the most significant update I've made, and I'll talk more about that in a moment. It's an automated system, meaning that I don't modify the predictions, even if I think that I could subjectively improve them. In other words, what the system predicts is what you see. The only place where there's an element of subjectivity is estimating playing time. For preseason predictions, I'll use the depth charts on Fangraphs. Otherwise, I try to make an educated guess about playing time. For example, a starting position player might be expected to get 650 plate appearances while a platoon player might only get 300 or 400.
The initial version of my system only predicted a single outcome for each player. That prediction was intended to be roughly the average scenario for that's player production in the upcoming season. That information is useful, but a team deciding whether to sign a free agent or trade for a player will also want some idea of the potential upside and downside for that player. You can't get that information from just looking at the average, which is why LEAFS uses an ensemble to make its predictions. Instead of just simulating a future season or perhaps several seasons once, LEAFS runs 5,000 simulations of the player's performance over one or more seasons. Each of these simulations is one possible trajectory for a player's career, and the outcome of past seasons does influence future seasons. For example, if a scenario has a player making a significant increase in production for 2025, that increase also affects that career trajectory for 2026 and beyond.
How LEAFS Works
One of the most important elements of predicting a player's future performance is how aging will affect the player. Although each player ages in a unique way, there are somewhat predictable trends for how each of a player's skills will evolve with age, so it's possible to make an educated guess about a player's future performance. LEAFS uses data from 2015-2023 and calculates how player skills evolved with age during that period. For example, the aging curve for exit velocity between ages 30 and 31 is the average of how exit velocity changed for all the players between ages 30 and 31 during the 2015-2023. Of course, this only includes players with enough playing time in both seasons to get a reasonably good sample of their exit velocity, and I require this to be 150 plate appearances in both seasons.
A common method for calculating the aging curve is to take a player's statistics in two consecutive years, subtract the stats in the first year from those in the second year, and then average this over a large number of players. This approach isn't perfect, and there is a "survivor bias" that occurs toward the end of players' careers. This is where players who have a good season are more likely to continue playing for another season, and then may be subject to a steeper decline in skills than players who retired a season earlier. There is probably a similar selection bias early in players' careers, where players who are promoted to the majors are likely to already have a high skill level, and those who perform better are less likely to be optioned back to the minors. This approach is far perfect, but LEAFS has some adjustments that I believe are useful in limiting the effects of bias toward the beginning and end of players' careers. This is an active area of development, and I'll likely make some changes between now and version 2 of LEAFS.
The data that goes into the aging curve is actually very noisy, so the aging curves that LEAFS calculates initially aren't smooth at all. LEAFS does a lot of additional smoothing of the data to make the aging curves appear somewhat smooth, but there's also some useful information in the noisy nature of the data. For example, if the aging curve predicts that exit velocity should drop by 0.3 mph, it certainly doesn't mean that every player's exit velocity drops by 0.3 mph. Some players might have their exit velocity drop a lot more, perhaps 1 or 2 mph, but a smaller proportion of players might actually have their exit velocity increase year over year. There's a lot of uncertainty in exactly how each player will age, so LEAFS calculates both the average and the standard deviation of the data. LEAFS uses these statistics to generate the 5,000 trajectories for how a player's skills could evolve with age.
Interpreting LEAFS Forecasts
After LEAFS calculates the estimated skills for each player in a season, those skills like exit velocity are used to predict the more familiar outcome-based statistics like batting average, slugging percentage, and earned run average. Generating five or six season of predictions for each player with 5,000 different possibilities in every season takes a couple of minutes to run on my computer and adds about 20-30 MB to my database of statistics. That's a tremendous amount of data, and it's impractical to review the 5,000 simulations individually and try to draw conclusions about a player's future performance. Therefore, I do a lot of postprocessing of the data to try to provide some useful guidance.
Let's take a look at some example projections I recently generated for Juan Soto's next 12 seasons. These projections assume that Soto will get 650 plate appearances per season. Because Soto will be a free agent after this season, these predictions are what we would expect if Soto played in a neutral park. One of the common types of analysis I do is to rank each statistic according to percentiles, then plot the results on a line graph. When the graphs show something like the 35th-45th percentile for doubles, I take all the projections that fall between the 35th and 45th percentiles for that season and average them.
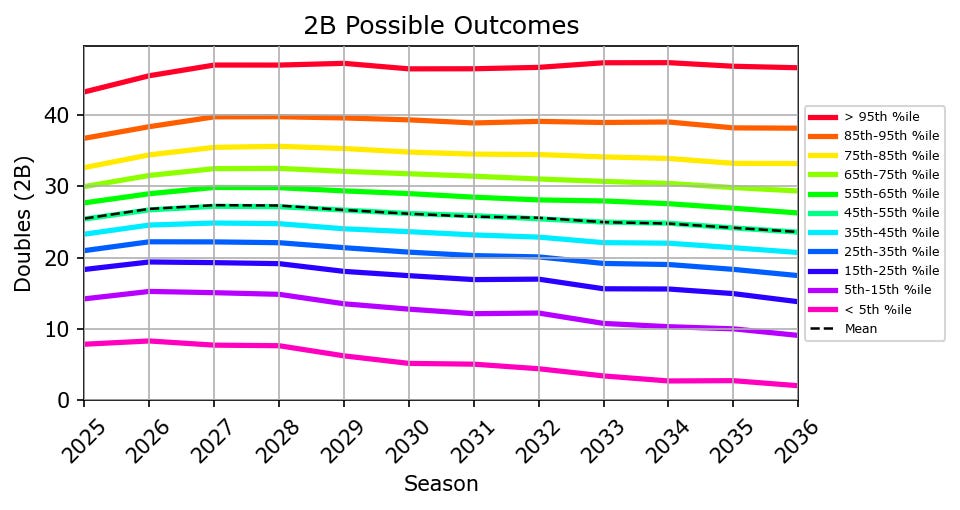
I also create the same type of graph, but with totals over the course of several seasons. In this case, I add up the number of doubles in each simulation starting in 2025. For example, the 35th-45th percentiles for 2027 take Soto's total number of doubles in each simulation between 2025-2027, then take the average of those simulations in that range of percentiles. Even for the best players at the top of their game, there's a lot of variability in their production from season to season. A player might hit in the 95th percentile one season and the 60th percentile the next season. The > 95th percentile line on this graph accounts for that and represents the very high end of Soto's possible production over the next 12 seasons. If I just added up the > 95th percentile of Soto's production for each season, I'd almost certainly dramatically overestimate his production. In the case of these charts, if I added up the high end of Soto's production in each season, I'd get an answer of around 550 or 560 doubles. That would probably overestimate the best case scenario by roughly 100 doubles, which is why I use this approach instead.

In addition to graphs like these, I also have tables showing the range of possibilities for a player's production in a season or over the course of several seasons. These are not exactly the same as the charts. The > 95th percentile for Soto's production in 2025 is around 43 doubles, 6 triples, 43 home runs, 23 stolen bases, 137 walks, and only about 85 strikeouts. It's definitely possible that Soto could hit 43 doubles in 2025, or he could hit 43 home runs, or he might steal 24 bases. It's far less likely that he would do all of these things in the same season. Putting all of these numbers on the same stat line would greatly overestimate the best case for Soto's production.
Because I want to show more realistic best and worst case scenarios for each player, I use a formula for hitters that's similar to OPS to estimate the player's overall production. The main difference is that I've added in contributions from stolen bases, getting caught stealing, and hitting into double plays. For pitchers, I just use ERA to measure their overall performance. I rank each season according to this measure of overall performance, then average all of the seasons that fall into each percentile range. This gives a more realistic idea of the best case for a player's overall production. I also do the same thing for career trajectories and also show the results in a table. The percentiles in the tables generally won't match the line graphs, but that's because the line graphs are intended to show the best and worse case scenarios for each stat while the tables are intended to realistically depict the best and worse case scenarios for overall production.

This table might appear to indicate that Soto is going to strike out 114-117 times in 2025, no matter what happens. That's not actually the case. For 2025, the best case for Soto is around 85 strikeouts, and the worst case is just above 145. There's actually quite a bit of variability in Soto's strikeout rate. There's also a difference of almost 50 walks between the highest and lowest percentile ranges for Soto, despite very little variability in this table. The correct interpretation here is that there's very little correlation between Soto's overall production and his strikeout or walk rate. If Soto strikes out a bit less or a bit more than expected, it will probably have very little effect on his overall production in 2025.

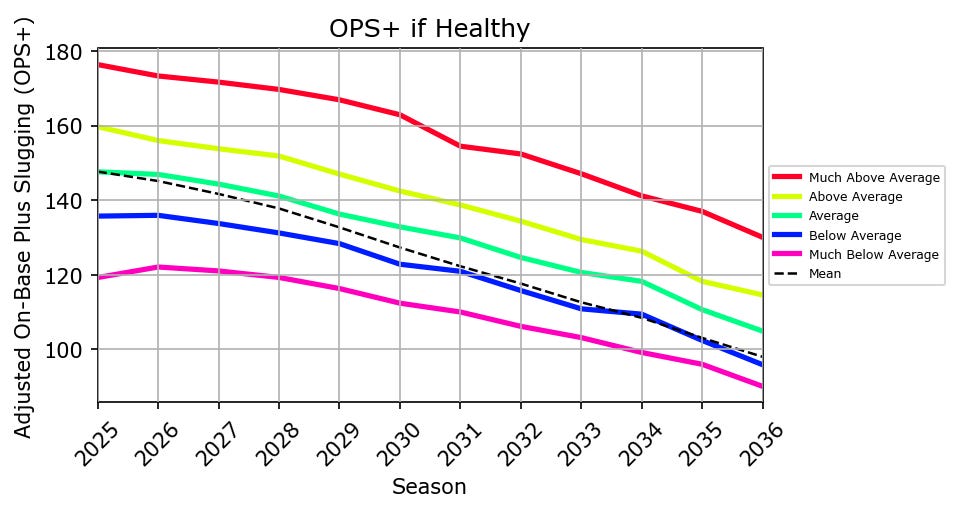
Soto is expected to get a long contract, probably somewhere in the range of 8-12 seasons. One of the risks for in a long-term contract is that a player could get injured early in the contract and have long-term effects that reduce their performance in later seasons. This risk is somewhat accounted for in the aging curve data that LEAFS uses. If a player was healthy enough to satisfy the minimum requirements for playing time, but with diminished performance, that will be in the estimates of how a player could age. The aging curve data will not account for situations where a player misses an entire season or nearly so because of an injury.

The injury risk adds up over the course of many seasons, meaning that a player who generally stays healthier than normal will probably perform somewhat above the 45th-55th percentile range. I try to estimate how well a player might perform if they can stay healthier than normal by starting with five different ranges in the first season, the 5th-15th (much below average), 25th-35th (below average), 45th-55th (average), 65th-75th (above average), and 85th-95th percentiles (well above average). These ranges are shifted upward slightly in each subsequent season, effectively avoiding some of the decline in production with age that is linked with injuries. From the ninth season onward, the line for average on these graphs actually corresponds to the 60th-70th percentile range, which can be a fairly large difference in production from the median. This is very experimental, and I plan to use these graphs very sparingly. But it's a first guess at how much better a player like Soto might perform over a long-term contract if they're able to stay healthy.
Calculating Player Value
One of the big questions I'll be trying to answer with this system, and one that's certainly relevant to Soto, is what type of the contract, both in terms of length and total value, that a player could or should receive in free agency. This requires taking these projections and converting them into a dollar value. My approach is to estimate a player's WAR for each season, then do some additional rough estimates to convert that into a monetary amount. LEAFS does not currently predict defense, though that will probably be incorporated into a future version. LEAFS also doesn't include a specific positional adjustment, which is also a component of WAR. Instead, for batters, LEAFS uses the 2002 formula for runs created (RC) and calculates this for each season. When estimating player value, I add a small positive adjustment to RC (aRC or adjusted runs created) in LEAFS because the total number of runs scored in the league is slightly above what is predicted by RC. For pitchers, LEAFS uses their expected earned runs, then increase it based on the league average number of unearned runs that the pitcher would be expected to allow.
LEAFS uses the same approach as Fangraphs and Baseball Reference of setting replacement level to a winning percentage of .294, then estimates the expected production for a typical player on a replacement level team. LEAFS subtracts this from the actual number of runs a player creates or allows to calculate the runs above replacement. For batters, positive numbers mean that a player has created more runs than a replacement level player. For pitchers, these numbers are negative when they outperform the replacement level player. LEAFS calculate runs above average in exactly the same way, except with a winning percentage of .500 instead of .294. The oRAR and oRAA columns are offensive runs above replacement and above average, respectively. The oWin% column is the expected winning percentage if a player is added to the roster of an otherwise average team.

Using these stats, LEAFS calculates WAR assuming the player takes the spot of a replacement level player on a team that was .500, then estimates how many more games the team should win. For pitchers, LEAFS uses that number as WAR. For batters, WAR also includes a defense and position adjustment, which I subjectively estimate for each player using data from Baseball Reference. To convert this into a dollar value, LEAFS estimates that 1 WAR was worth $8.6 million in 2023, then assumes its value increases 3% in each season. A player's predicted WAR for each season is multiplied by the estimated dollar value for 1 WAR to determine the overall value.

You'll see a lot more graphs and tables like these in my upcoming articles. LEAFS is in development, so I'll update this article if there are any significant changes in either the actual production system or the type of analysis I show in my articles. In the future, I plan to incorporate more Statcast variables, minor league statistics, and defensive metrics for each player. I also plan to revisit the aging curve data to try to identify and improve any issues that I notice. LEAFS isn't perfect, but I think it's more than good enough to generate some useful predictions for players' future production over the next several seasons.
Tomorrow’s article will be a more in-depth look at the projections for Juan Soto and the potential megacontract he will likely receive in the offseason. If you’d like to read more high-quality baseball content like a detailed look at the contract Soto might receive in free agency, be sure to subscribe so you can get more content from The Linked Letters delivered to your inbox.
Statistics cited in this article are sourced from Baseball Reference, Fangraphs, and Retrosheet. If you’d like to read more baseball-related content like this, please consider subscribing. You can also help The Linked Letters grow by sharing articles on social media. I plan to accept paid subscriptions in the near future.