

Which Formula 1 Circuits Produce the Most Exciting Races?
Monaco produces the least overtaking, but how do other circuits compare?


Monaco is a spectacular venue, but there’s very little overtaking when Formula 1 races on the streets of Monte Carlo. Tracks where passing is difficult can produce good racing when drivers have to be creative and skillful to overtake, and positions gained are more likely to have an impact on the final results than if it’s easier to pass. The problem isn’t just that it’s difficult to pass at Monaco, it’s nearly impossible to do so on track. Still, more overtaking doesn’t necessarily mean that the racing is better, and so my goal is to develop a more nuanced statistical approach than just the number of overtakes per race.
This season's Monaco Grand Prix was widely panned by fans and those within Formula 1. The narrow streets of Monaco have always made overtaking on track difficult, making qualifying particularly important compared to other circuits. In principle, mandating two pit stops allowed for teams to be more strategic to maintain or advance their track position. However, some teams adopted the strategy of one of their cars intentionally running several seconds off the pace of the leaders to open up massive gaps in the running order. There have been many suggestions like mandating a pit stop early in the race, instituting minimum lap times, and changing the track layout to allow for more overtaking on track. I don't believe that I have anything novel to suggest about improving quality of racing at Monaco. Instead, I'd like to try to partially quantify how entertaining the racing is at many of F1's circuits.
What Makes a Good Race?
What actually makes a race entertaining to watch? Monaco's problem is that the cars have become so large that there's almost no possibility to overtake on the narrow streets of Monte Carlo. There needs to be a reasonable amount of overtaking, otherwise it's not really a race at all. But more overtaking doesn’t always produce better racing.
The other extreme is where overtaking is incredibly easy and the running order gets shuffled many times over during a race. There's often plenty of overtaking in NASCAR at Daytona and Talladega, but it also means that the running order at lap 30 of the Daytona 500 probably doesn't have that much impact on track position at lap 200. It can be fun to watch, but the much of the entertainment value comes from cars making quick lane changes, throwing blocks with very little space between cars, and somehow not wrecking way more often than they do. To someone like me who's never driven a race car outside of video games, it is still very easy for me to see that pack racing takes a lot of skill, and that these really are the best stock car drivers in the world. But particularly with the tendency for huge wrecks at Daytona and Talladega, it means that an overtake early in the race probably won't make that much of a difference in the final running order. The big one is inherently a part of pack racing at high speeds, but when a big wreck can take out a significant part of the field, it means that track position early in the race just doesn’t matter as much.
Leverage
In baseball, leverage refers to how much the outcome of a play affects the probability that a team will win the game. High leverage situations typically occur in the late innings of a close game, especially when there are runners on base. Racing is a bit different because we're not just concerned with the probability of a driver winning a race but also how the rest of the field finishes. But the basic idea is that a pass on the final lap of a race probably matters a lot more in the final running order than a pass on lap 1. Instead of trying to duplicate the approach used in baseball, I define leverage by calculating the correlation between the running order at a point in the race and the finishing order, then taking the absolute value.
I've not seen any negative correlations in the data, but it's not completely implausible. A negative correlation could occur if cars that pit earlier go to the back of the field, but those cars get an advantage at the end of the race by undercutting the rest of the field.
Position Advancement
For this analysis, I only consider the running order at the start of the race, at the end of each lap, and the final finishing order. If a driver has advanced their position from where they were in the previous lap, then it counts as a position advanced. If cars swap positions multiple times during a lap, they're not treated as separate advancements. It only matters if the positions have swapped at the end of the lap. But if the top two cars swap positions on one lap, then they swap positions again on the next lap, they're treated as separate advancements. I also make no attempt to distinguish between advancements that occur because of passing on track, cars retiring from the race, or passing cars that have pitted.
In my graphs, position advancement is actually calculated over a 10% window of the race. Although most F1 races are approximately the same distance, that's not necessarily the case with other series. In a longer race, there will be more opportunities for overtaking, and that will tend to inflate the number of positions advanced within any 10% segment of the race. to account for this, I scale the rate of positions advanced upward for shorter races and downward for longer races.
The reason I refer to this as advancement rather than overtaking is because I'm not really measuring the frequency of overtakes, especially if one car overtakes another during a lap and then the positions are swapped again by the end of the lap. To make this distinction clear, I've tried to be careful in my terminology throughout the article. This approach isn't perfect, but it does seem to be closely related to how much overtaking occurs during a race and when those overtakes occur. I believe it's good enough for the analysis I'm trying to do.
Estimating the Excitement
I quantify the overall excitement during the race by multiplying the advancement frequency by the leverage. There certainly are instances where a viewer might disagree with my estimate of excitement, though, and I'll mention some of them. This approach doesn't consider overtaking attempts that fail, or when one car on fresher tires is quickly gaining on another car with worn tires over a period of many laps. It also doesn't consider the difficulty of overtakes on track, or how apparent the skill of the racing is to the viewer. These caveats mean that a viewer might still be entertained by a race with limited overtaking, or that it might underestimate the excitement of the chaotic NASCAR races at Daytona and Talladega. This approach certainly isn't perfect, but I believe it still is very useful for distinguishing tracks with exciting racing from those where it's somewhat boring.
How the Calculations are Done
I use a couple of Python scripts that make extensive use of the FastF1 library and some other common Python libraries like Matplotlib, NumPy and SciPy. The source code is available on Github under the open source GPLv3 license. As a reminder, it's not free for me to build software tools, write this content, and host it online. I do have very real expenses, and your contributions will help me be able to continue making additional content freely available. Over the past couple of years, I've created a lot of software tools for working with sports and scientific data, and I'd like to share that knowledge. Please contribute to me as you are able so that I can continue doing this. I assure you that everything I write is my own work, and I never use artificial intelligence to create any of the content I'm sharing with you. If you'd like to contribute, please see my about page for ways to help me financially. Generosity at any level is greatly appreciated.
Because of the data I used in these calculations, it is currently limited to races from 2018 onward. It's definitely possible to do this for pre-2018 races, and I'd eventually like to extend this at least back to the start of the turbo-hybrid era in 2014. I've only included circuits with at least three races between 2018-2024. I've also omitted the 2021 Belgian Grand Prix, which wouldn't provide meaningful data about the tendencies of the racing at each circuit. That's the race session where two laps were done behind a safety car in extremely wet conditions, then the race was red flagged and never resumed. Points were awarded, but there was never actually any green flag racing,
One other consideration is that some of the circuits have changed during the 2018-2024 period. Several of the turns at Yas Marina (Abu Dhabi) have been reconfigured, the final chicane at Barcelona (Spain) was removed, and a chicane in the final sector of the Marina Bay Street Circuit (Singapore) no longer exists. Although these have noticeably impacted the racing at these circuits, I've treated the old and new configurations as being the same circuit for the purposes of this analysis. The one exception is the "outer circuit" at Bahrain that was used for the 2020 Sakhir Grand Prix, which omitted many turns, dramatically shortened the circuit, and was even described as almost being an oval. I drew the somewhat arbitrary line and included both pre- and post-reconfiguration races at Spain, Singapore, and Abu Dhabi as being at the same circuit, but did not include the 2020 Sakhir Grand Prix with the other races in Bahrain.
Overall Data
The next three figures are a bit messy, and that's okay because I’ll go into detail about each circuit later. There are 25 circuits included in the data, which is far too many to pick out individual circuits within the color scheme. The main point of these images is to show how leverage, advancement, and excitement vary throughout a typical race, and how this differs from circuit to circuit. Because the races don't have the same number of laps, I've plotted the data based on the percentage of the race completed. The mean of the circuits is only the races at these 25 circuits, not all of the races held during 2018-2024.
Leverage

There's a wide range in the leverage at the start of races, with the leverage being highest at Monaco and lowest at Austin (United States). This can be interpreted to mean that qualifying is most important at Monaco, where the starting order has a large impact on the finishing positions of the cars. At circuits like Austin and Albert Park (Australia), the starting order isn't nearly as well correlated to the finishing order, meaning that qualifying doesn’t matter as much.
Advancement
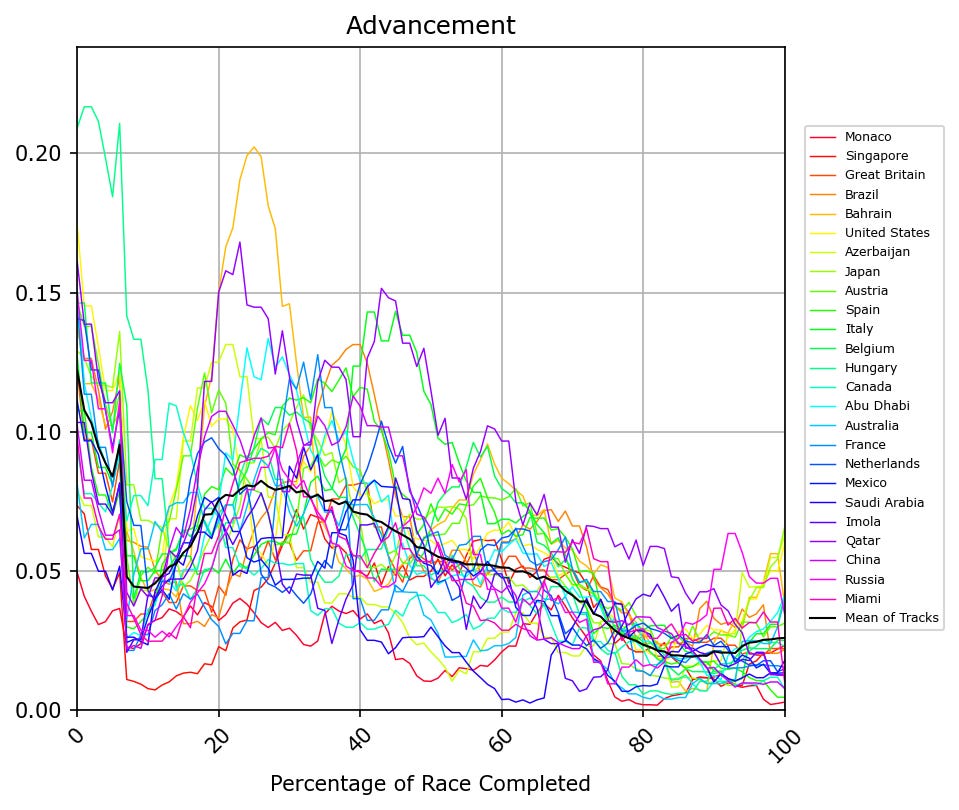
Looking at advancement, the mean shows a lot of positions gained in the opening laps of a race, then another peak around 25% of the way through the race. It declines until about 50% through the race, then plateaus before declining again after about 65% of the race distance.
The start of an F1 race is usually chaotic with a lot of positions being gained or lost on the opening lap and the potential for collisions to shake up the running order. After the initial excitement, cars often settle into their positions until the pit window opens. That explains the peak around 25% of the way through the race, where the running order can become jumbled as some teams make early pit stops while others choose to remain out on older tires. But this peak isn't at the same time at all circuits, and some circuits where a one stop strategy is common can be expected to have this peak a bit later.
Although there's not a secondary peak around 65% of the way through the race, it almost looks that way from the shape of the mean. Some individual circuits like Bahrain do actually have a secondary peak around this part of the race. This is to be expected where the either circuit favors a two stop strategy, or with a one-stop strategy when some teams choose to start their cars on harder tires and run later in the race before pitting.
Excitement

The mean of the excitement looks quite similar to the advancement, but it declines less in the middle and later stages of the race. This is to be expected since the leverage is generally higher at later points in the race as the field gets sorted out somewhat. There aren't as many overtakes later in the race, but those overtakes often matter more because cars that gain positions later in the race are more likely to keep those positions through the finish.
Individual Circuits
I'm not going to comment on every circuit, but I am including individual graphs for every circuit in my analysis. Unlike the first three spaghetti plots, it's a lot easier to see what's going on with each circuit.
Abu Dhabi

Australia

Austria

Azerbaijan

Bahrain

Belgium

Brazil

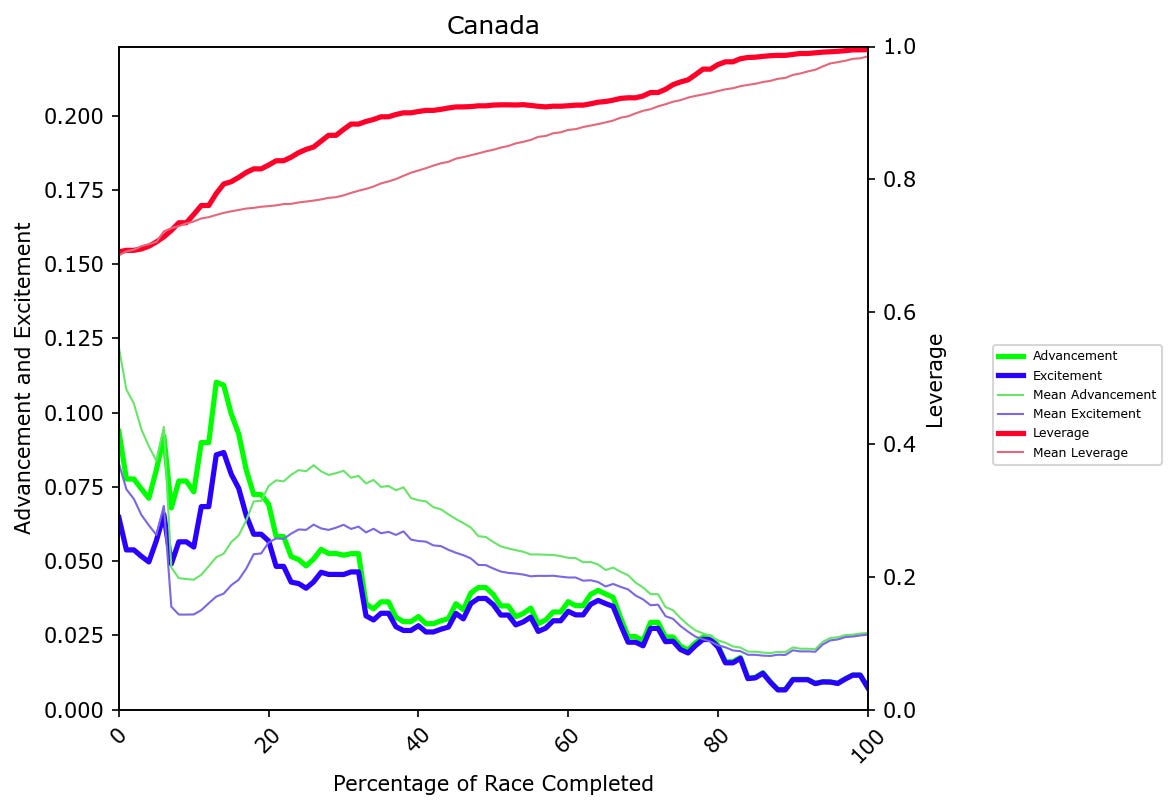
Canada
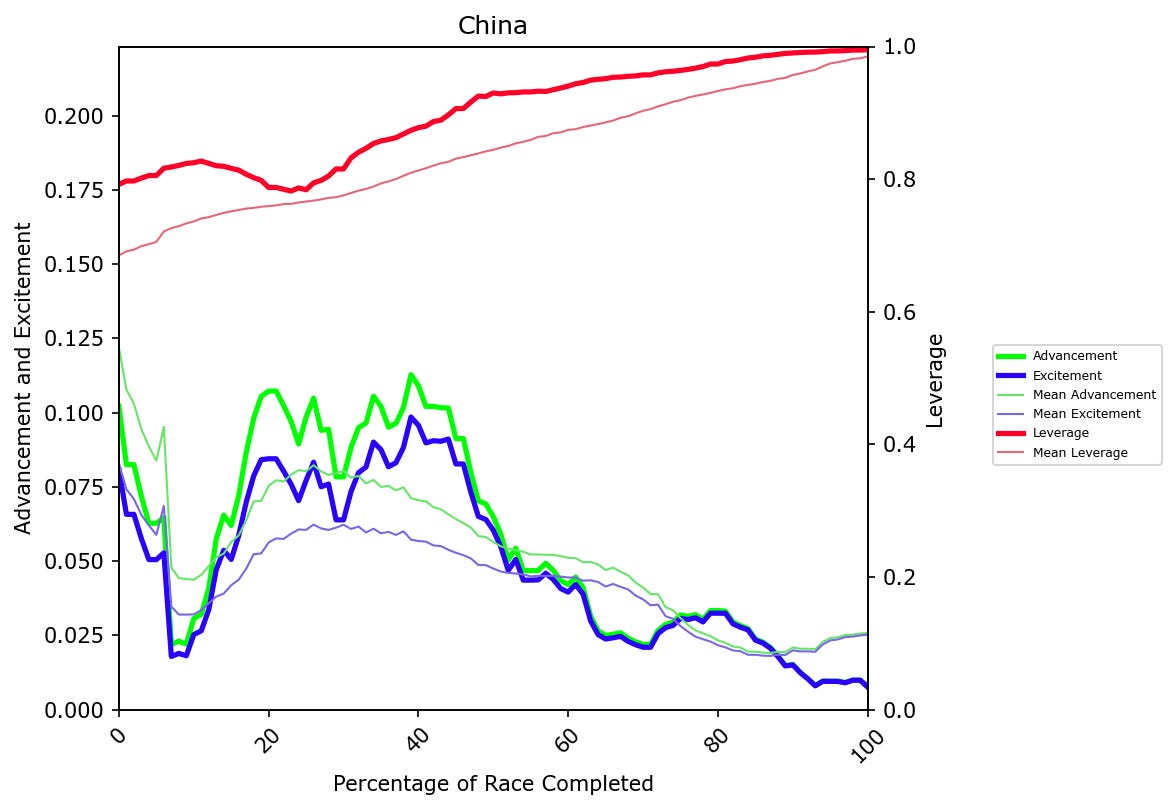
China
France

Great Britain

Hungary

Imola

Italy (Monza)

Japan

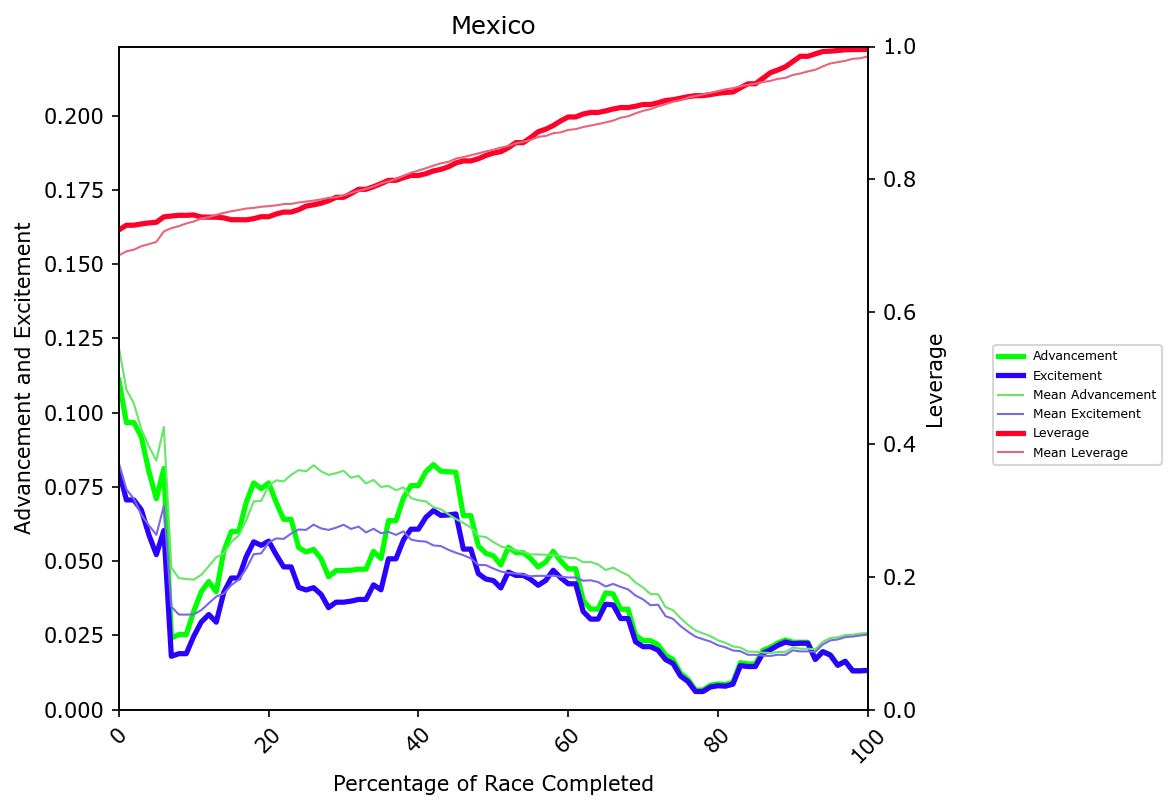
Mexico
Miami

Monaco

Netherlands

Qatar

Russia

Saudi Arabia

Singapore

Spain

United States (Austin)
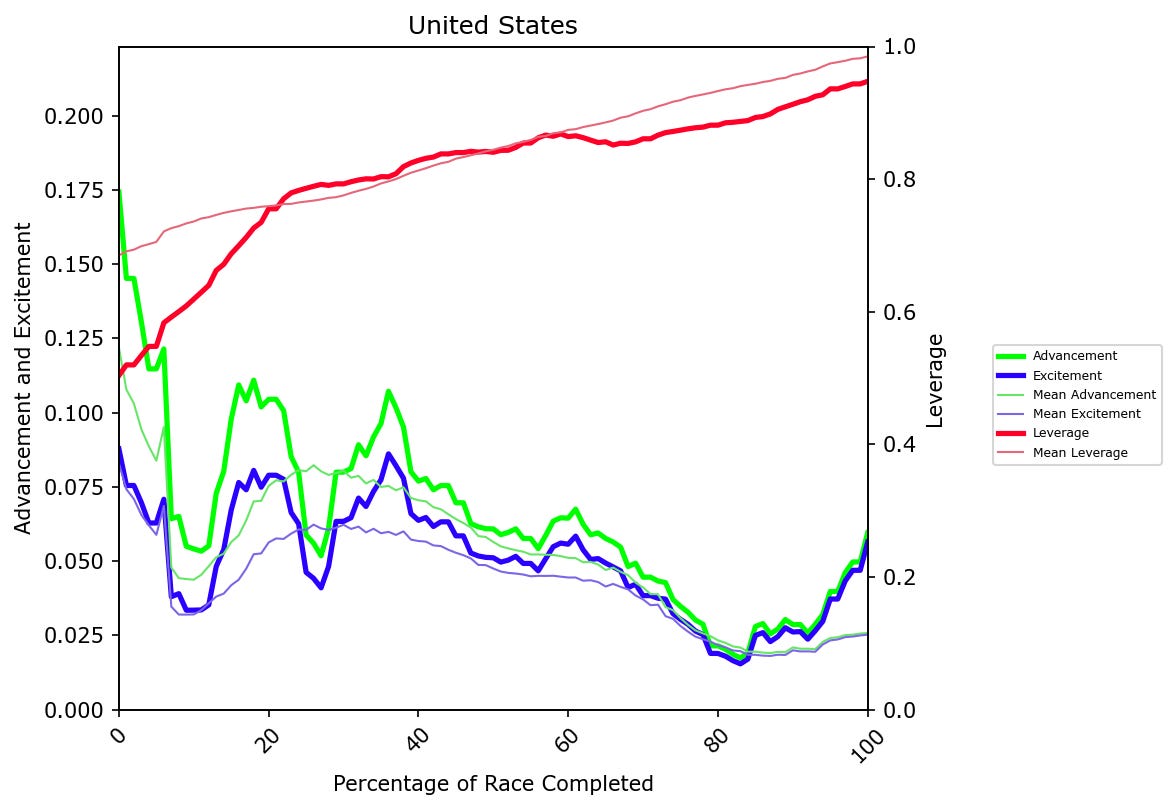
Instead of doing the easy thing and complaining that there's not much overtaking at Monaco, I'd like to instead compare Baku (Azerbaijan), Albert Park, and Austin. Of all 25 circuits in this analysis, these three have the lowest leverage at the start of the race, meaning that the starting order has the least impact on the finishing positions. Baku actually has a lot of overtaking around 20% of the way through the race, but the race ranks low in terms of overall excitement.
Unlike Austin and Albert Park, where the leverage begins low and rapidly increases through the first 20% of the race, it begins low at Baku and remains low through much of the race. Although there's a lot of overtaking around 20% of the way through the race at Baku, leverage remains low, and the excitement only rises to around the overall mean level at this point in the race. Baku has a history of late race safety cars and retirements that can jumble the field and heavily impact the finishing order. The data show that earlier overtakes don't necessarily mean as much earlier in the race. By comparison, the field tends to get sorted out somewhat in the first few laps at Austin, meaning that although the peak in advancement around 20% of the race is lower there, it still rates higher in excitement than at Baku. Nothing in F1 comes remotely close to the chaos in NASCAR at Daytona and Talladega when the big one occurs in the closing laps of a race and a lot of the field takes damage. However, that basic premise still applies here somewhat in that the tendency for late race crashes and retirements means that overtaking earlier in the race at Baku doesn't have as much impact on the final positions.
Abu Dhabi is another circuit where the data is quite interesting and perhaps a bit unexpected. Generally speaking, leverage should increase throughout the race as the cars get sorted out closer to their finishing positions. That's not really what happens at Abu Dhabi and a few other circuits, though. Leverage peaks around 20% through the race, then decreases to a minimum around 30%, and then increases significantly after that. This also happens at a few other circuits like Imola, Qatar, Shanghai (China), and Suzuka (Japan), but it's very pronounced at Abu Dhabi. It means that for the segment of the race roughly from 20-30% of race distance, cars that advance their position during this period actually tend to finish farther back in the field at the end of the race. This suggests that cars pitting earlier in the race come out farther back in the field, but those cars have a significant advantage at the end of the race when the running order gets sorted out. Put another way, it’s a sign that the undercut is rather powerful at Abu Dhabi.
Compare this to Bahrain, where a two stop strategy is typical because of high tire wear, and position advancement peaks around 25% of the race distance with a secondary peak around 55%. One might expect that due to the high tire wear, pitting early would provide a big advantage so that cars can put in fast laps on fresh tires and overtake cars that pit later. The small decline in leverage around the first and second pit windows suggest that there's a small advantage to pitting a bit earlier than other cars, but it's not nearly as large as at Abu Dhabi. The leverage at Bahrain is also below the mean of all circuits throughout the entire race, so it gets penalized in terms of excitement despite a high rate of positions being advanced. There's a history of fast cars having late race retirements at Bahrain, with 2022 being an example where both Red Bulls retired in the final few laps of the race, significantly affecting the finishing order.
The final circuit I'm going to discuss individually is Barcelona, which was heavily criticized in the past for being a boring race, but overtakes have greatly increased since the final chicane was removed. Of all 25 circuits included in this analysis, Barcelona has the second highest leverage at the start of the race, only behind Monaco. It suggests that qualifying is very important at this circuit, but Barcelona doesn't race like Monaco at all. The racing at Monaco is often described as a procession, where huge cars have virtually no overtaking opportunities through the narrow confines of the circuit. In contrast, Barcelona is actually above average for advancing positions.
The high leverage at Monaco is intuitive, but it doesn't make as much sense at Barcelona, where overtaking is frequent. High tire wear requires teams to make two or even three pit stops during the race, leading to multiple strategies and opportunities for positions to be gained or lost during the race. The Sky Sports commentary during qualifying and the race earlier this year at Spain explained that cars with fast pace on a single qualifying lap also tend to have a good pace on longer runs at Barcelona, which isn't necessarily the case at other circuits. It's not that qualifying is especially important at Barcelona since overtaking is hardly rare, but that qualifying is a very good predictor of which cars will be fastest during the race. The result is a high rate of overtaking but also high leverage throughout the race, and so Barcelona rates highly in terms of race excitement.
Which Circuits Actually Produce the Best Racing?
I've aggregated the data together into tables for leverage, advancement, and excitement that compare each of the 25 circuits. I include the mean, median, maximum, and minimum values, as well as the values at the start and the finish of the race. For example, the leverage at the start of the race is a pretty good indicator of how much qualifying (or qualifying pace) matters at each circuit.
Leverage

Advancement

Excitement

One part that surprised me was to see how low Montreal (Canada) and Silverstone (Great Britain) ranked in advancement and race excitement. Many subjective lists of the best races on the F1 calendar place these circuits close to the top, which differs greatly from these results. However, they actually rank pretty close to the bottom in other lists of how much overtaking occurs at each circuit. More overtaking doesn't necessarily guarantee a high rank in race excitement, and Baku is a good example of this. Many circuits like Barcelona and the Hungaroring (Hungary) are frequently criticized for poor racing but actually rank above average. As a reminder, my analysis doesn't measure whether overtaking at these circuits visually appears difficult to fans, and some circuits like Monaco that are difficult to drive don't necessarily produce entertaining racing. I'm not measuring the same thing as many subjective ratings do, but I still think it's notable where the data agrees and differs from people's opinions about the quality of the racing.
One thing that stands out is that of all the circuits that rank above average for position advancement, all of them are road courses rather than street circuits. Although Abu Dhabi has some elements of street circuits, it is still a road course and was built when Yas Island was developed for the purpose of being a racing circuit. This differs from actual street circuits like Jeddah (Saudi Arabia), Singapore, Monaco, and Baku. The Abu Dhabi circuit has also undergone modifications to try to improve the quality of the racing. Although being a purpose built racing circuit doesn't guarantee that there will be a lot of overtaking, it definitely seems to make a difference. Formula 1 has trended toward more street circuits, and this raises the question of whether this adversely affects the quality of the racing.
What's Next?
I plan to update these ratings again after the 2025 season is over. At that point, Las Vegas will have three races and will be included in the results. I'd like to extend this analysis back to 2014 to encompass the entirety of the turbo-hybrid era, but I'll need to find a new data source in order to do that.
With adequate data, the approach here can be applied to other racing series as well. For example, NASCAR publishes JSON files with lap-by-lap data that includes the running order of the field. NASCAR's data encompasses the entirety of the NextGen car era, so there's enough data for a direct comparison to F1. This can also be replicated across NASCAR's three national series over the last few years. I won't be offering an opinion on whether NASCAR or F1 racing is better since I watch and enjoy both, but I think it's interesting to statistically compare the racing between them. If you've browsed the Github source repository, you might have noticed that I already have a file to do this analysis with NASCAR data, and that’s a pretty good sign that I might have a future article repeating this for NASCAR tracks.