

Week 3 College Football Ratings for FCS, Division II, and Division III Teams
Would Division III's North Central College be competitive if they played in a higher division?

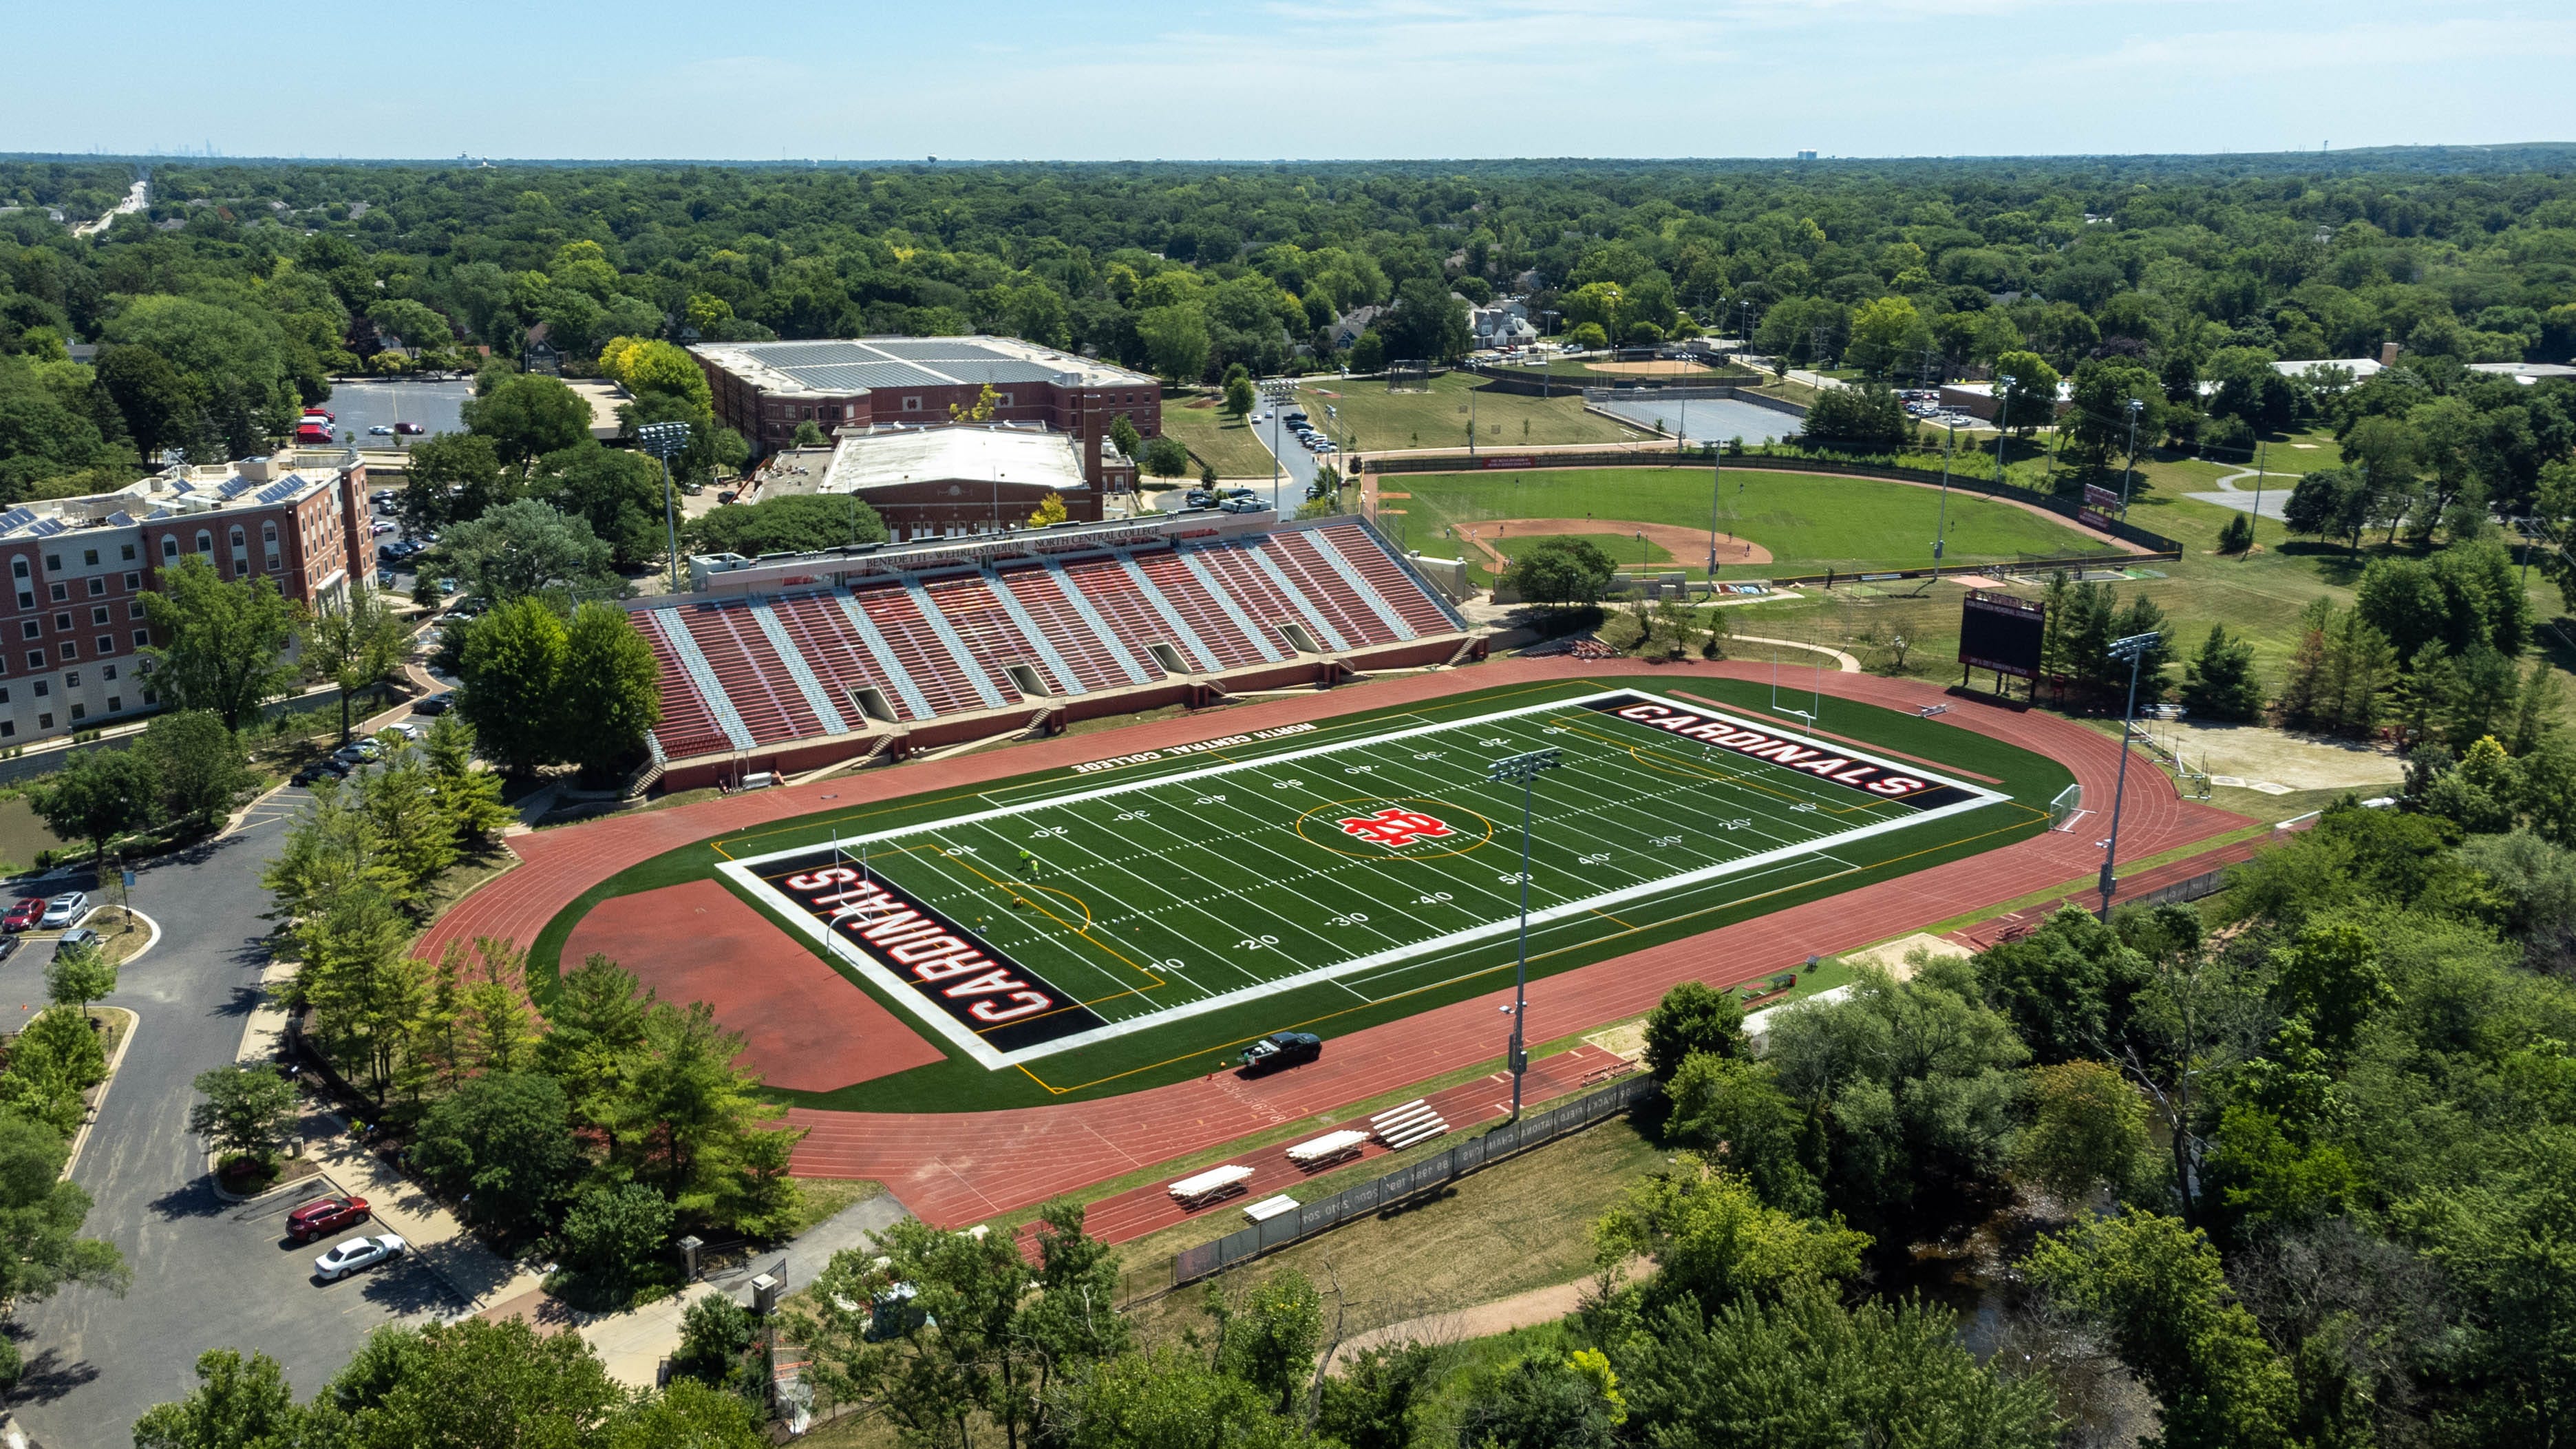
A couple of weeks ago, I wrote an article about graph theory and why it's a challenge to rank teams across all divisions in NCAA football. FBS and FCS teams play rather frequently, and the many points of comparison mean that this isn't too difficult. FCS teams also play Division II schools somewhat often, and Division II conferences are fairly well connected to each other. Although FBS teams don't schedule games against Division II teams, I suspect teams from these divisions are accurately ranked relative to each other. Division III is much more challenging because there are only a few games against higher division opponents. Even Division III conferences aren't connected to each other as well as in higher divisions. North Central is dominant against Division III competition, but in that article, I mused about how they might fare against an FBS or FCS teams. The photo at the top of this article is Benedetti-Wehrli Stadium in Naperville, IL. It's the home of the North Central Cardinals. What would actually happen if they visited a couple of Big Ten stadiums and played those teams?
In Bill Connelly's article this morning on ESPN, he had an interesting comment about this topic in his preview of one of this weekend's Division III games:
Well, you can't question UW-Oshkosh's bravery. A week after opening the season in Oregon and beating a top-15 Linfield team, the Titans return to the Midwest to take on Division III's standard-bearer. North Central would immediately be a competitive FCS program, but this is a tricky season debut for the champs.
By competitive, I assume Connelly means that North Central would be at least comparable to an average FCS team if not above average. Although I'm not certain what his basis is for this, I assume it's based on his SP+ ratings across all NCAA divisions. As with Connelly's SP+ rating system, my ratings are also forward-looking to predict the outcome of future games. Do my ratings agree that North Central would be competitive at the FCS level right now?
Lower Division Ratings
Based on early results, I suspect that my alternative ratings are actually a better measure of team quality than my original approach. As a reminder, the alternative ratings use the same algorithm as the original ratings, but they allow games from the 2025 season to impact the ratings to a greater extent. Until now, I've only posted the FBS portion of the ratings, but the rating system does include lower division teams as well.
FCS Ratings
Overall Ratings
Home advantage: 2.81 points
Mean score: 26.28 points
Rank Rating Team                     Offense Defense
   1 51.64  North Dakota State       27.53   24.34
   2 46.24  South Dakota State       18.43   27.80
   3 40.26  Montana State            23.93   16.18
   4 39.51  Tarleton State           19.98   19.59
   5 34.20  North Dakota             23.08   11.29
   6 30.40  Idaho                    12.28   18.11
   7 29.95  Austin Peay              10.44   19.47
   8 29.42  Montana                  17.09   12.36
   9 28.41  West Georgia             13.54   15.07
  10 27.71  Northern Arizona         13.23   14.41
  11 27.24  South Dakota             12.72   14.67
  12 26.93  Holy Cross               11.91   14.99
  13 26.59  Tennessee Tech           12.83   13.79
  14 26.47  Southern Utah            16.88   9.66
  15 24.83  Sacramento State         9.42    15.41
  16 24.26  Illinois State           10.53   13.73
  17 24.04  Stephen F. Austin        9.05    14.84
  18 23.68  New Hampshire            6.44    17.25
  19 23.65  Southern Illinois        12.81   10.81
  20 23.13  Incarnate Word           10.40   12.73
Rank Rating Team                     Offense Defense
  21 22.70  South Carolina State     11.32   11.22
  22 22.55  Harvard                  12.19   10.54
  23 22.50  UC Davis                 15.22   7.13
  24 22.43  Abilene Christian        13.46   9.02
  25 22.06  Idaho State              14.64   7.44
  26 22.03  Lehigh                   10.27   11.89
  27 21.81  Richmond                 6.13    15.58
  28 21.51  Eastern Kentucky         7.33    14.16
  29 21.44  Towson                   7.73    13.75
  30 21.17  Monmouth                 22.65   -1.37
  31 20.68  Yale                     14.72   5.75
  32 20.53  Youngstown State         13.38   7.13
  33 20.25  Elon                     9.52    10.88
  34 20.01  UT Martin                9.43    10.40
  35 19.97  Villanova                4.03    15.96
  36 19.96  East Tennessee State     12.62   7.55
  37 19.73  Mercer                   4.25    15.28
  38 19.11  Northern Iowa            9.66    9.45
  39 18.71  Cal Poly                 13.56   5.13
  40 18.65  Eastern Washington       15.39   3.25
Rank Rating Team                     Offense Defense
  41 18.64  SE Louisiana             7.69    11.18
  42 18.22  Rhode Island             6.53    11.66
  43 17.56  Columbia                 0.28    17.09
  44 17.26  Southeast Missouri State 9.54    7.81
  45 17.21  Dartmouth                8.88    8.40
  46 16.94  Central Arkansas         12.23   4.86
  47 16.31  UT Rio Grande Valley     7.69    8.57
  48 16.23  Nicholls                 5.33    11.04
  49 16.23  The Citadel              5.04    11.18
  50 16.09  Drake                    5.37    10.82
  51 15.84  Maine                    7.32    8.43
  52 15.79  Jackson State            6.91    9.00
  53 15.63  St. Thomas (MN)          10.82   4.81
  54 15.62  Lafayette                7.01    8.63
  55 15.22  McNeese                  6.12    9.22
  56 15.09  Weber State              9.84    5.25
  57 15.01  Lamar                    1.59    13.43
  58 14.55  Chattanooga              7.37    7.34
  59 14.45  Pennsylvania             6.55    7.97
  60 14.38  Gardner-Webb             14.21   0.11
Rank Rating Team                     Offense Defense
  61 14.07  Wofford                  -0.73   14.80
  62 13.82  Alabama State            6.04    7.78
  63 13.44  William & Mary           6.16    7.12
  64 13.06  San Diego                4.21    8.83
  65 12.99  Morgan State             5.14    7.65
  66 12.63  Lindenwood               2.57    10.04
  67 12.48  Utah Tech                8.53    4.10
  68 12.22  Long Island University   6.59    5.63
  69 12.04  UAlbany                  6.46    5.68
  70 12.04  North Carolina Central   6.25    5.78
  71 12.03  Indiana State            7.60    4.58
  72 11.87  Western Carolina         13.75   -1.78
  73 11.76  Cornell                  9.23    2.59
  74 11.10  Merrimack                0.47    10.54
  75 11.03  Georgetown               4.29    6.53
  76 11.00  North Alabama            5.50    5.36
  77 10.85  Duquesne                 8.67    2.27
  78 10.66  Houston Christian        4.51    6.16
  79 9.56   Colgate                  5.80    3.67
  80 8.59   Western Illinois         12.25   -3.70
Rank Rating Team                     Offense Defense
  81 8.58   Charleston Southern      -5.87   14.41
  82 8.45   Presbyterian             4.85    3.57
  83 8.23   Butler                   4.86    3.44
  84 7.50   Mercyhurst               3.62    3.95
  85 7.45   Alabama A&M              10.87   -3.31
  86 7.09   Bucknell                 8.71    -1.62
  87 7.09   Bryant                   0.90    6.18
  88 7.00   Brown                    7.29    -0.22
  89 6.93   Northern Colorado        -3.55   10.55
  90 6.71   Stony Brook              3.26    3.46
  91 6.10   Tennessee State          1.50    4.73
  92 5.96   Dayton                   -3.61   9.67
  93 5.88   Portland State           6.36    -0.46
  94 5.59   Princeton                3.81    1.78
  95 5.54   Furman                   4.85    0.69
  96 5.40   Hampton                  4.26    1.05
  97 4.89   East Texas A&M           6.33    -1.44
  98 4.85   Eastern Illinois         2.05    3.12
  99 4.74   Central Connecticut      2.58    2.16
 100 4.65   Wagner                   -0.62   5.27
Rank Rating Team                     Offense Defense
 101 4.47   Bethune-Cookman          1.51    2.97
 102 4.43   Norfolk State            1.92    2.35
 103 3.94   Samford                  -0.66   4.56
 104 3.24   Campbell                 3.81    -0.67
 105 2.86   Sacred Heart             -7.34   10.15
 106 2.58   Robert Morris            1.37    1.19
 107 1.91   Prairie View A&M         -0.86   2.84
 108 1.70   Florida A&M              -2.28   3.95
 109 1.28   Delaware State           4.73    -3.32
 110 0.88   Fordham                  0.59    0.29
 111 0.51   Grambling                1.56    -1.14
 112 -0.26  St. Francis (PA)         -7.28   7.01
 113 -0.71  Howard                   -4.69   3.98
 114 -1.95  Texas Southern           -3.18   1.22
 115 -2.42  Murray State             4.43    -6.82
 116 -2.69  North Carolina A&T       2.22    -4.81
 117 -2.83  VMI                      -2.35   -0.40
 118 -3.50  Alcorn State             -5.96   2.46
 119 -4.18  Morehead State           -2.71   -1.28
 120 -4.37  Southern                 -5.26   0.90
Rank Rating Team                     Offense Defense
 121 -5.81  Stonehill                -2.13   -3.78
 122 -7.15  Marist                   -5.16   -1.70
 123 -7.27  Valparaiso               -9.66   2.37
 124 -8.77  Arkansas-Pine Bluff      -2.91   -5.78
 125 -12.24 Northwestern State       -4.94   -7.14
 126 -12.89 New Haven                -5.98   -7.07
 127 -13.93 Davidson                 -0.27   -13.63
 128 -15.35 Mississippi Valley State -2.90   -12.40
 129 -18.33 Stetson                  -9.03   -9.52
As I've said before, FCS and FBS teams play regularly, so I have a high level of confidence in comparing the quality of teams across these subdivisions.
Division II Ratings
Overall Ratings
Home advantage: 2.81 points
Mean score: 26.28 points
Rank Rating Team                          Offense Defense
   1 35.07  Ferris State                  21.95   13.12
   2 28.85  Harding University            18.23   10.66
   3 22.23  Angelo State                  8.05    14.20
   4 21.97  Virginia Union                14.56   7.72
   5 21.47  Minnesota Duluth              11.34   10.06
   6 18.75  Michigan Tech                 10.86   7.96
   7 15.95  CSU Pueblo                    12.08   3.87
   8 15.92  Tiffin                        8.56    7.32
   9 15.84  Kutztown University           7.24    8.55
  10 15.28  Minnesota State Mankato       8.85    6.41
  11 14.87  Indianapolis                  10.89   4.03
  12 14.69  Grand Valley State University 8.74    5.95
  13 14.45  Pittsburg St                  0.98    13.47
  14 14.00  Fort Hays State               5.43    8.43
  15 13.93  West Florida                  7.84    6.12
  16 12.36  Valdosta State                5.73    6.61
  17 12.25  Augustana University (SD)     3.52    8.57
  18 12.19  UT Permian Basin              1.50    10.64
  19 11.60  Central Washington            5.77    5.83
  20 11.50  University Of Charleston (WV) 8.54    2.95
Rank Rating Team                          Offense Defense
  21 11.28  Wingate                       -2.25   13.46
  22 11.15  Emory & Henry College         4.55    6.73
  23 11.12  Southern Arkansas             10.21   1.06
  24 10.56  Emporia State University      6.40    4.13
  25 10.48  Delta State                   2.56    7.77
  26 10.27  Ouachita Baptist              2.76    7.47
  27 10.19  Findlay                       9.08    1.26
  28 10.16  Johnson C Smith               1.52    8.64
  29 10.09  Albany State GA               8.33    1.77
  30 9.33   Northwest Missouri St         3.88    5.39
  31 9.23   PennWest California           2.09    7.21
  32 8.96   Sioux Falls                   5.26    3.60
  33 8.91   Virginia St                   5.30    3.68
  34 8.82   Central Oklahoma              12.24   -3.58
  35 8.51   Central Missouri              11.78   -3.28
  36 8.36   West Alabama                  1.66    6.61
  37 8.32   Ashland                       0.31    8.02
  38 8.15   Western Colorado              6.57    1.70
  39 8.06   Nebraska-Kearney              4.82    3.24
  40 6.80   Missouri Western              5.82    0.91
Rank Rating Team                          Offense Defense
  41 6.79   Bemidji State                 -0.64   7.41
  42 6.76   Slippery Rock                 -0.12   7.00
  43 6.47   Saginaw Valley State          4.64    1.78
  44 5.52   Indiana-Pennsylvania          -3.62   9.29
  45 5.11   Carson-Newman College         1.84    3.26
  46 5.00   Colorado School Of Mines      4.88    0.07
  47 4.10   Limestone                     5.54    -1.36
  48 3.99   Davenport                     -5.89   9.79
  49 3.96   Wayne State (NE)              0.35    3.59
  50 3.60   Hillsdale                     -3.40   6.94
  51 3.34   Fort Valley State             1.27    2.08
  52 2.77   Henderson State               3.86    -1.11
  53 2.54   UNC Pembroke                  8.61    -6.15
  54 2.35   Minnesota State Moorhead      7.28    -5.07
  55 2.06   Truman State                  2.08    -0.01
  56 1.24   Edward Waters                 6.14    -5.03
  57 0.50   Quincy                        -3.68   4.21
  58 0.44   Edinboro University           -2.71   2.97
  59 -0.09  West Chester                  -0.70   0.50
  60 -0.21  Black Hills State             2.54    -2.76
Rank Rating Team                          Offense Defense
  61 -0.25  Lenoir-Rhyne                  -0.78   0.70
  62 -0.27  Minot State                   -3.72   3.59
  63 -0.38  Winston-Salem                 -2.49   2.19
  64 -0.76  Northwood (MI)                -6.56   5.68
  65 -0.84  Roosevelt                     -2.19   1.35
  66 -1.96  Winona State                  -2.58   0.50
  67 -2.22  Northern State                -0.13   -2.02
  68 -2.24  Mars Hill                     -1.15   -0.97
  69 -2.32  Bowie State                   -2.18   -0.04
  70 -2.34  Western Oregon                -4.36   2.01
  71 -2.48  Tuskegee                      -5.20   2.76
  72 -2.57  Washburn                      -5.45   2.94
  73 -2.67  Clark Atlanta                 3.83    -6.48
  74 -3.31  East Stroudsburg University   -2.97   -0.43
  75 -4.00  Southeastern Oklahoma State   -4.71   0.75
  76 -4.01  East Central (OK)             -5.95   1.76
  77 -4.22  Walsh                         -1.53   -2.66
  78 -4.46  Northeastern State            -2.41   -2.09
  79 -5.10  McKendree                     -1.74   -3.48
  80 -5.18  Wayne State (MI)              -6.02   0.76
Rank Rating Team                          Offense Defense
  81 -5.65  Colorado Mesa                 -8.35   2.73
  82 -5.97  Clarion                       -4.94   -1.09
  83 -5.99  Chadron St                    -8.14   2.02
  84 -6.38  Texas A&M-Kingsville          -5.09   -1.22
  85 -6.40  Frostburg State               1.92    -8.36
  86 -6.43  Fayetteville State            -8.94   2.54
  87 -6.50  Franklin Pierce               -2.97   -3.56
  88 -6.65  West Texas A&M                -1.13   -5.44
  89 -6.89  William Jewell                -4.74   -2.12
  90 -7.35  Upper Iowa University         -5.40   -2.02
  91 -7.37  Arkansas Tech                 -5.55   -1.80
  92 -7.75  Ohio Dominican                -11.24  3.29
  93 -8.22  Bloomsburg                    -2.05   -6.04
  94 -8.28  Anderson (Sc)                 -4.67   -3.54
  95 -8.94  Lock Haven University         -7.81   -1.13
  96 -9.06  Miles College                 -8.17   -0.98
  97 -9.10  Missouri S&T                  -1.17   -7.96
  98 -9.33  Benedict College              -11.98  2.62
  99 -9.55  Northern Michigan             -1.23   -8.44
 100 -9.92  St. Anselm                    -7.65   -2.40
Rank Rating Team                          Offense Defense
 101 -10.26 Fairmont State                0.17    -10.46
 102 -10.41 Seton Hill                    -7.56   -2.78
 103 -10.42 Shepherd                      -6.77   -3.56
 104 -10.86 Catawba                       -2.73   -8.11
 105 -10.91 Gannon                        -2.65   -8.19
 106 -11.10 Livingstone                   -11.85  0.57
 107 -11.31 Bentley                       -7.49   -3.99
 108 -11.39 North Greenville              -3.76   -8.14
 109 -11.51 Missouri Southern State       -0.93   -10.65
 110 -12.67 Assumption                    -7.75   -4.92
 111 -12.74 South Dakota Mines            -8.48   -4.27
 112 -12.89 Chowan                        -4.18   -8.71
 113 -14.71 Newberry                      -10.49  -4.22
 114 -14.84 Glenville State               -10.41  -4.55
 115 -14.92 Elizabeth City State          -13.93  -1.12
 116 -14.93 Allen                         -2.75   -12.24
 117 -15.32 Thomas More College           -8.89   -6.41
 118 -16.51 Midwestern State              -11.34  -5.17
 119 -16.98 West Virginia State           -5.84   -11.16
 120 -18.02 Kentucky Wesleyan             -11.50  -6.49
Rank Rating Team                          Offense Defense
 121 -18.04 Shaw                          -7.97   -10.06
 122 -19.43 Millersville                  -5.60   -13.87
 123 -19.93 Savannah St                   -16.37  -3.40
 124 -19.98 Southern Connecticut State    -9.27   -10.62
 125 -20.11 Wheeling                      -12.00  -8.01
 126 -20.22 Greeneville                   -8.91   -11.25
 127 -21.11 Wilson                        -14.75  -6.26
 128 -21.24 Kentucky State                -6.80   -14.42
 129 -21.33 New Mexico Highlands          2.86    -24.39
 130 -21.34 Southern Nazarene             -11.03  -10.54
 131 -21.65 Lincoln (MO)                  -13.88  -7.72
 132 -22.52 Concordia University St Paul  -10.87  -11.86
 133 -23.04 Southwestern Oklahoma State   -13.46  -9.27
 134 -23.10 University of Mary            -13.00  -10.24
 135 -23.57 Eastern New Mexico            -13.04  -10.56
 136 -23.83 Southwest Baptist             -10.62  -13.08
 137 -23.89 Post University               -8.28   -15.55
 138 -23.92 Shippensburg                  -18.46  -5.46
 139 -24.03 Lincoln (PA)                  -10.99  -13.03
 140 -24.10 Lake Erie                     -7.65   -16.49
Rank Rating Team                          Offense Defense
 141 -24.93 Arkansas-Monticello           -10.47  -14.66
 142 -25.09 Lane College                  -10.53  -14.55
 143 -25.29 Morehouse College             -11.93  -13.23
 144 -25.73 Shorter                       -20.71  -5.05
 145 -25.74 Northwestern Oklahoma State   -13.76  -11.93
 146 -25.75 Oklahoma Baptist              -10.66  -15.04
 147 -25.78 American International        -14.63  -11.20
 148 -26.82 UVA Wise                      -12.19  -14.75
 149 -27.97 Western New Mexico            -7.81   -20.11
 150 -28.08 Central State (OH)            -19.21  -8.72
 151 -29.01 Pace                          -16.83  -12.27
 152 -30.11 Fort Lewis                    -13.38  -16.78
 153 -31.76 West Liberty                  -13.78  -17.93
 154 -33.76 Concord University            -15.02  -18.81
 155 -34.29 ERSKINE                       -19.94  -14.36
 156 -37.58 Adams State                   -18.35  -19.09
 157 -37.93 Bluefield State               -14.64  -23.21
 158 -38.07 Southwest Minnesota State     -23.64  -14.27
 159 -40.20 Sul Ross State                -12.78  -27.41
 160 -44.10 West Virginia Wesleyan        -17.47  -26.68
Rank Rating Team                          Offense Defense
 161 -53.25 Oklahoma Panhandle St         -27.93  -25.19
 162 -53.66 Lincoln (CA)                  -18.09  -35.51
FBS schools no longer schedule games against Division II opponents because those games don't count for bowl eligibility. However, FCS teams still do routinely play Division II competition. Even though there are no direct connections between FBS and Division II, both are connected well enough to FCS teams that I still have a high level of confidence in these ratings relative to FBS teams.
Division III Ratings
Overall Ratings
Home advantage: 2.81 points
Mean score: 26.28 points
Rank Rating Team Offense Defense
1 35.81 North Central College 21.94 13.65
2 28.56 Wisconsin-Platteville 10.29 18.42
3 22.62 Wisconsin-River Falls 15.38 7.34
4 21.38 Hope College 10.10 11.24
5 21.35 Saint John's (MN) 13.96 7.39
6 20.64 Bethel (MN) 14.34 6.24
7 19.62 Grove City College 6.01 13.62
8 18.97 Wisconsin-Oshkosh 6.39 12.60
9 18.14 University of Mount Union 11.19 6.85
10 17.57 Wisconsin-Lacrosse 7.00 10.57
11 17.50 Depauw 7.94 9.56
12 16.63 Johns Hopkins University 3.42 13.21
13 16.50 Wisconsin-Whitewater 6.72 9.89
14 15.66 Mary Hardin-Baylor 5.51 10.10
15 15.25 Salisbury 17.50 -2.30
16 13.77 Wheaton 10.91 2.72
17 11.27 Alma 12.31 -0.99
18 11.26 Marietta 2.04 9.41
19 10.79 Cortland 7.77 3.02
20 10.66 Hardin-Simmons 9.30 0.83
Rank Rating Team Offense Defense
21 10.58 Linfield College 7.37 3.21
22 10.08 Central College 1.24 8.81
23 9.72 Coe College 5.88 3.91
24 9.48 Washington University (St. Louis) 5.23 4.25
25 8.88 Christopher Newport 4.14 4.73
26 8.36 Susquehanna 9.13 -0.77
27 7.94 Wartburg -2.84 10.86
28 7.14 Brockport -3.71 10.84
29 6.80 Carnegie Mellon -0.03 6.77
30 6.55 John Carroll University 5.14 1.64
31 5.69 Berry College 6.51 -0.93
32 4.47 Wisconsin-Stout 10.02 -5.40
33 4.33 Springfield 6.57 -2.33
34 4.07 Ursinus 3.13 0.94
35 3.21 Muhlenberg 7.50 -4.46
36 2.64 Randolph-Macon 2.59 -0.01
37 2.58 Wabash College 6.38 -4.13
38 1.18 Utica 5.66 -4.40
39 0.98 Case Western Reserve -0.17 1.15
40 0.40 Franklin & Marshall -3.64 4.05
Rank Rating Team Offense Defense
41 0.27 Westminster (PA) -6.41 6.64
42 0.16 Whitworth -1.84 1.90
43 -0.23 Wisconsin-Eau Claire 2.72 -2.95
44 -0.49 Hobart College -6.29 5.68
45 -0.82 Maryville College (TN) -3.64 2.77
46 -1.58 Rowan -4.49 2.89
47 -1.97 East Texas Baptist University 2.66 -4.71
48 -2.09 Illinois Wesleyan -0.70 -1.59
49 -2.10 Dubuque 1.65 -3.72
50 -2.22 Trinity University TX -3.79 1.57
51 -2.69 Aurora 0.67 -3.48
52 -2.90 Chapman 1.02 -4.10
53 -3.11 Concordia Moorhead -7.44 4.36
54 -3.29 Wilkes 0.90 -4.19
55 -3.58 Alfred University 2.05 -5.70
56 -4.58 Washington & Jefferson 3.88 -8.46
57 -4.67 Kings College (PA) -6.77 1.86
58 -5.43 Baldwin Wallace -4.94 -0.49
59 -6.17 Ithaca College -2.37 -3.80
60 -6.49 Claremont-Mudd-Scripps College -11.52 4.98
Rank Rating Team Offense Defense
61 -6.50 Centre College Kentucky -7.40 0.86
62 -6.52 Hampden-Sydney 0.58 -7.21
63 -6.94 Monmouth (IL) -2.80 -3.80
64 -7.16 Adrian -10.11 2.76
65 -7.39 Endicott College -5.76 -1.84
66 -8.32 Rensselaer -6.71 -1.61
67 -9.54 Dickinson (PA) -0.62 -9.11
68 -9.55 Washington and Lee -8.40 -1.15
69 -10.38 College Of New Jersey -1.31 -8.87
70 -11.27 Moravian -8.31 -3.06
71 -11.61 Carroll University (WI) -13.34 1.44
72 -11.91 Gustavus Adolphus -11.80 -0.25
73 -12.25 Stevenson -4.99 -7.42
74 -12.39 Albion -4.02 -8.19
75 -12.41 Illinois College 0.67 -13.29
76 -12.49 St John Fisher University -12.12 -0.40
77 -12.88 Lake Forest College -8.06 -4.82
78 -13.76 Lebanon Valley -6.49 -7.30
79 -13.89 Western New England -4.11 -10.08
80 -13.97 Southwestern University -7.22 -6.71
Rank Rating Team Offense Defense
81 -14.24 St. Olaf -11.23 -3.01
82 -14.35 Lewis & Clark College -3.33 -11.02
83 -14.42 Bridgewater (VA) -6.29 -8.19
84 -14.55 Texas Lutheran -7.45 -7.00
85 -14.85 Wisconsin-Stevens Pt -9.19 -5.67
86 -14.89 Shenandoah -8.07 -6.76
87 -14.98 Mount St. Joseph -1.22 -13.76
88 -15.37 Eastern University -10.47 -4.90
89 -15.50 Union (NY) -13.50 -2.01
90 -15.80 Pacific Lutheran -11.75 -4.14
91 -16.09 Hanover College -7.93 -8.16
92 -16.13 Pomona Pitzer -8.71 -7.42
93 -16.13 McMurry -13.08 -2.84
94 -16.77 Trine University -7.90 -8.98
95 -17.13 Merchant Marine Academy -6.79 -10.37
96 -17.23 Carleton -8.00 -9.19
97 -17.32 Heidelberg 0.43 -17.69
98 -17.38 Ohio Northern -7.88 -9.30
99 -17.46 Ohio Wesleyan -4.34 -13.12
100 -17.94 Denison University -9.97 -7.97
Rank Rating Team Offense Defense
101 -18.10 Delaware Valley -14.94 -3.16
102 -18.21 California Lutheran University -11.81 -6.63
103 -18.38 Howard Payne -13.08 -5.30
104 -18.45 Augustana (IL) -6.10 -12.30
105 -18.70 SUNY Morrisville -17.50 -1.40
106 -18.74 Calvin University -0.62 -18.00
107 -18.89 University of Rochester (NY) -11.76 -7.21
108 -19.12 Lycoming -11.37 -7.75
109 -19.26 Muskingum University -10.17 -9.12
110 -19.33 Kean -12.08 -7.24
111 -19.34 Salve Regina -16.33 -3.01
112 -19.48 Pacific (OR) -8.32 -11.21
113 -19.75 Huntingdon College (AL) -4.15 -15.67
114 -20.06 Belhaven -6.12 -14.03
115 -20.19 Widener -10.26 -9.90
116 -20.85 Wittenberg -12.44 -8.31
117 -21.30 Montclair State -17.47 -4.09
118 -21.44 Chicago -17.99 -3.42
119 -21.85 Franklin -11.58 -10.27
120 -22.66 St. Norbert -12.11 -10.92
Rank Rating Team Offense Defense
121 -23.42 North Park -10.16 -13.56
122 -23.85 Simpson College (IA) -6.40 -17.45
123 -23.96 FDU-Florham -14.58 -9.27
124 -24.58 Misericordia -13.37 -11.23
125 -24.67 Hendrix College -9.83 -15.00
126 -24.95 Rose-Hulman -12.42 -12.53
127 -25.35 Catholic -16.04 -9.49
128 -25.40 NEWBERG -18.59 -7.08
129 -25.49 Redlands -22.04 -3.46
130 -25.50 Western Connecticut St -7.96 -17.57
131 -25.81 Sewanee -13.70 -12.22
132 -25.95 Lagrange College -10.44 -15.53
133 -26.22 UMass Dartmouth -5.27 -20.96
134 -27.14 Benedictine University -20.83 -6.47
135 -28.26 Reading -12.20 -16.07
136 -28.33 Brevard College -13.02 -15.47
137 -28.85 Carthage -13.60 -15.24
138 -29.08 Augsburg -13.29 -15.65
139 -29.42 Worcester Polytechnic Institute -19.03 -10.39
140 -29.50 North Carolina Wesleyan -11.96 -17.50
Rank Rating Team Offense Defense
141 -29.59 McDaniel College -25.85 -3.88
142 -29.86 Millsaps -13.91 -16.07
143 -30.00 Northwestern (MN) -11.87 -18.17
144 -30.03 Kalamazoo -18.45 -11.60
145 -30.20 Rhodes College -13.79 -16.60
146 -30.47 Gettysburg -11.67 -18.80
147 -30.52 Concordia-Wisconsin -18.03 -12.71
148 -30.59 SUNY Maritime -13.31 -17.43
149 -30.78 William Paterson -21.96 -9.10
150 -30.99 Elmhurst -11.22 -19.64
151 -31.85 MIT -23.29 -8.93
152 -32.01 Olivet College -14.01 -18.01
153 -32.64 Nebraska Wesleyan -17.66 -14.82
154 -32.90 Waynesburg -15.28 -17.77
155 -33.83 St. Scholastica -10.83 -22.98
156 -34.18 Greenville -21.34 -12.83
157 -34.22 CENTENARY -15.38 -18.86
158 -34.36 St. Lawrence -22.52 -11.84
159 -35.02 Ferrum -18.44 -16.66
160 -36.13 Biddeford -15.48 -20.65
Rank Rating Team Offense Defense
161 -36.29 Buffalo State -18.29 -18.23
162 -37.32 Coast Guard -4.75 -32.49
163 -37.66 Capital -13.39 -24.11
164 -37.91 Millikin -19.06 -18.80
165 -38.18 Wilmington (OH) -10.52 -27.57
166 -38.19 Loras College -13.87 -24.33
167 -39.17 Geneva -17.44 -21.67
168 -39.65 Juniata College -13.29 -26.36
169 -39.77 Lakeland -5.91 -33.92
170 -39.97 Methodist -26.79 -13.33
171 -40.39 Wisconsin-Lutheran -19.97 -20.42
172 -40.54 La Verne -14.75 -25.89
173 -40.55 Keystone -10.66 -29.89
174 -40.71 Allegheny -16.96 -24.01
175 -40.73 Austin -23.72 -16.58
176 -41.27 Kenyon -31.93 -9.34
177 -41.30 Curry College -15.47 -25.83
178 -41.41 Cornell College (IA) -17.11 -24.16
179 -41.46 Husson -18.97 -22.49
180 -42.50 Bluffton -17.08 -25.42
Rank Rating Team Offense Defense
181 -43.23 Otterbein -18.30 -25.01
182 -43.32 Puget Sound -12.66 -30.68
183 -43.38 Greensboro College -26.87 -16.88
184 -43.66 Wooster -13.96 -29.64
185 -43.95 Albright -31.76 -12.39
186 -44.04 LYONCOLL -21.75 -22.22
187 -44.29 Ripon -21.92 -22.61
188 -44.42 Hamline University -20.23 -24.19
189 -46.19 Mass Maritime -33.56 -12.63
190 -46.68 Macalester -27.36 -19.30
191 -46.86 Martin Luther -27.16 -19.82
192 -47.01 Willamette -23.25 -23.76
193 -47.11 Anna Maria College -18.34 -28.79
194 -47.35 Bridgewater State -25.14 -22.24
195 -47.95 Rockford -20.16 -28.01
196 -48.05 Buena Vista -23.35 -24.64
197 -49.07 Norwich -31.92 -17.18
198 -49.65 Hiram College -25.21 -24.43
199 -49.79 Guilford College -29.04 -20.75
200 -49.79 Saint Vincent -29.12 -20.67
Rank Rating Team Offense Defense
201 -50.19 Minnesota Morris -32.96 -17.23
202 -50.83 Plymouth State -25.51 -25.38
203 -51.20 Thiel -30.05 -21.23
204 -52.14 Gallaudet -30.48 -21.64
205 -52.40 Alfred State -34.98 -17.72
206 -54.27 Hartwick -25.10 -29.17
207 -54.80 Southern Virginia -27.63 -27.16
208 -55.05 Grinnell -30.34 -24.69
209 -56.39 Bethany (WV) -28.58 -27.99
210 -56.45 Crown College -32.60 -23.85
211 -57.13 Nichols College -19.50 -37.96
212 -57.14 Averett -24.65 -32.66
213 -58.52 Anderson (IN) -38.49 -20.02
214 -58.68 Beloit -36.83 -21.92
215 -61.62 Concordia University Chicago -23.52 -38.10
216 -61.75 Castleton -35.35 -26.51
217 -62.53 Knox College -34.42 -28.32
218 -63.16 Worcester St -33.01 -30.14
219 -63.78 Apprentice School -33.68 -30.10
220 -64.38 Westminster College (MO) -33.54 -30.78
Rank Rating Team Offense Defense
221 -64.92 Luther -36.90 -28.14
222 -64.93 Westfield State -37.90 -27.02
223 -65.39 Hilbert College -35.74 -29.82
224 -67.31 Lawrence University -31.65 -35.98
225 -68.28 Fitchburg State -34.42 -33.86
226 -70.20 Eureka College -42.39 -28.12
227 -71.06 Framingham State -35.14 -35.94
228 -73.54 Manchester -40.34 -33.01
229 -86.46 Oberlin -38.51 -47.81
230 -95.84 Dean College -49.09 -47.35
231 -102.77 Maine Maritime -45.53 -57.52 It gets a lot more difficult to rank Division III teams against higher divisions because there just aren't that many games to make this comparison. There's more uncertainty in the relative quality of Division III teams compared to higher divisions. But there were still about a dozen connections between Division III and other divisions in 2024, so it's still possible to make an educated guess about this.
Based on these ratings, North Central would be comparable to the top Division II teams, and they would be ranked among the top FCS teams. Even if my ratings overrated Division III by two touchdowns, it would still put North Central in the top five Division II teams, and they'd be ranked just outside the FCS top 25. Despite my uncertainty about the ratings of Division III teams, I absolutely agree that North Central would be competitive right away in the FCS.
I'd like to see Division II and III teams occasionally play FBS competition again, and I believe it would be good for college football. I'm a Mizzou fan, but I'm not particularly interested in seeing the Tigers play a spring scrimmage at Faurot Field. And I’m hardly the only person who thinks that spring games aren’t very entertaining. With USC, Ohio State, and Nebraska, and many others cancelling their spring games this year, it's possible the spring game will be phased out entirely. Instead of doing this, I propose replacing spring scrimmages with something better. What if each FBS team invited a couple of Division II and III opponents to visit them each spring for exhibition games, then split the ticket revenue with their opponent? What if Missouri invited a couple of opponents from around the state like Washington University (the school in St. Louis, not the FBS school in Seattle), Northwest Missouri State, or Central Missouri? And what if North Central traveled from Naperville to Evanston and Champaign for games against Northwestern and Illinois, repsectively? That would be a lot more interesting, and the revenue would be financially beneficial for smaller schools.
So what would really happen if North Central visited Illinois and Northwestern? Illinois has a rating of 59.02, and with the 2.81 point home advantage, my ratings would make them 26.02 point favorites. However, Northwestern has a rating of 39.55. With the home advantage added in, that makes them just 6.55 point favorites. Even if Division III is overrated by a couple of touchdowns and the spread increased to 20.55 points, that still wouldn’t reach the 30 point threshold for a blowout that I use in my predictions.
Game Predictions
An article on The Linked Letters with college football ratings just isn't complete if it’s not accompanied by some predictions for upcoming games. If I posted predictions for every game across the lower divisions, this would be a really long article. Instead, I'll just post the predictions for the top 10 highest rated games from each division.
The games are ranked based on the projected quality. This factors in the overall strength of the two teams and the potential for a competitive game. Game quality ratings are not directly comparable between college football and the NFL. NFL games are typically decided by smaller margins than college games, the teams are more balanced in their quality, and there's just not as much scoring in the NFL. Thresholds for close games and blowouts are also different between college and the NFL for the same reasons. That said, projected quality is directly comparable across different divisions of college football. Even with the lower ratings for teams at these divisions, the projected quality for the top games at these divisions is better than many FBS games.
Beside each team, there are two numbers in parentheses. One is the predicted margin of victory (positive) or defeat (negative), the other is the probability of winning. These margins are sometimes larger than what's indicated by the predicted score. That's because there's nothing in the math that prevents a prediction of negative points with a sufficiently lopsided matchup. This is, of course, impossible, so the score is set to zero in those instances. There's no cap on how many points a team can be projected to score, though.
FCS Predictions
#1: North Dakota (1.96, 55.53%) at Montana (-1.96, 44.47%)
Estimated score: 35.60 - 33.49, Total: 69.08
Quality: 89.09%, Team quality: 84.34%, Competitiveness: 99.42%
Blowout probability (margin >= 30.0 pts): 3.93%
Close game probability (margin <= 7.0 pts): 37.66%
High scoring probability (total >= 66.0 pts): 53.46%
Low scoring probability (total <= 38.0 pts): 19.06%

#2: Northern Arizona (-1.57, 45.56%) at Southern Utah (1.57, 54.44%)
Estimated score: 28.44 - 30.16, Total: 58.60
Quality: 86.41%, Team quality: 80.48%, Competitiveness: 99.62%
Blowout probability (margin >= 30.0 pts): 3.87%
Close game probability (margin <= 7.0 pts): 37.78%
High scoring probability (total >= 66.0 pts): 41.74%
Low scoring probability (total <= 38.0 pts): 28.08%

#3: Southern Illinois (0.82, 52.32%) at UT Martin (-0.82, 47.68%)
Estimated score: 27.28 - 26.31, Total: 53.59
Quality: 82.93%, Team quality: 75.56%, Competitiveness: 99.90%
Blowout probability (margin >= 30.0 pts): 3.79%
Close game probability (margin <= 7.0 pts): 37.95%
High scoring probability (total >= 66.0 pts): 36.33%
Low scoring probability (total <= 38.0 pts): 33.02%

#4: New Hampshire (1.40, 53.96%) at Ball State (-1.40, 46.04%)
Estimated score: 22.84 - 21.43, Total: 44.27
Quality: 82.68%, Team quality: 75.30%, Competitiveness: 99.70%
Blowout probability (margin >= 30.0 pts): 3.85%
Close game probability (margin <= 7.0 pts): 37.83%
High scoring probability (total >= 66.0 pts): 27.02%
Low scoring probability (total <= 38.0 pts): 42.99%

#5: Monmouth (-2.82, 42.07%) at Charlotte (2.82, 57.93%)
Estimated score: 33.76 - 36.17, Total: 69.93
Quality: 82.12%, Team quality: 74.87%, Competitiveness: 98.79%
Blowout probability (margin >= 30.0 pts): 4.11%
Close game probability (margin <= 7.0 pts): 37.30%
High scoring probability (total >= 66.0 pts): 54.41%
Low scoring probability (total <= 38.0 pts): 18.42%

#6: Eastern Washington (-3.28, 40.82%) at Northern Iowa (3.28, 59.18%)
Estimated score: 30.82 - 34.10, Total: 64.92
Quality: 80.25%, Team quality: 72.48%, Competitiveness: 98.38%
Blowout probability (margin >= 30.0 pts): 4.23%
Close game probability (margin <= 7.0 pts): 37.05%
High scoring probability (total >= 66.0 pts): 48.79%
Low scoring probability (total <= 38.0 pts): 22.41%

#7: East Tennessee State (-11.27, 21.28%) at West Georgia (11.27, 78.72%)
Estimated score: 22.43 - 33.68, Total: 56.11
Quality: 78.90%, Team quality: 77.30%, Competitiveness: 82.20%
Blowout probability (margin >= 30.0 pts): 9.65%
Close game probability (margin <= 7.0 pts): 28.16%
High scoring probability (total >= 66.0 pts): 39.03%
Low scoring probability (total <= 38.0 pts): 30.49%

#8: The Citadel (-0.97, 47.26%) at Gardner-Webb (0.97, 52.74%)
Estimated score: 29.81 - 30.73, Total: 60.54
Quality: 77.75%, Team quality: 68.61%, Competitiveness: 99.86%
Blowout probability (margin >= 30.0 pts): 3.80%
Close game probability (margin <= 7.0 pts): 37.92%
High scoring probability (total >= 66.0 pts): 43.88%
Low scoring probability (total <= 38.0 pts): 26.27%

#9: Eastern Kentucky (-14.05, 16.06%) at Marshall (14.05, 83.94%)
Estimated score: 13.76 - 27.92, Total: 41.68
Quality: 77.60%, Team quality: 79.71%, Competitiveness: 73.55%
Blowout probability (margin >= 30.0 pts): 13.21%
Close game probability (margin <= 7.0 pts): 23.87%
High scoring probability (total >= 66.0 pts): 24.66%
Low scoring probability (total <= 38.0 pts): 45.87%

#10: Rhode Island (-11.52, 20.77%) at Holy Cross (11.52, 79.23%)
Estimated score: 16.41 - 27.94, Total: 44.35
Quality: 77.59%, Team quality: 75.72%, Competitiveness: 81.46%
Blowout probability (margin >= 30.0 pts): 9.94%
Close game probability (margin <= 7.0 pts): 27.78%
High scoring probability (total >= 66.0 pts): 27.10%
Low scoring probability (total <= 38.0 pts): 42.90%
Division II Predictions
#1: Grand Valley State University (-2.58, 42.75%) at Pittsburg St (2.58, 57.25%)
Estimated score: 20.14 - 22.72, Total: 42.86
Quality: 76.88%, Team quality: 67.76%, Competitiveness: 98.99%
Blowout probability (margin >= 30.0 pts): 4.05%
Close game probability (margin <= 7.0 pts): 37.41%
High scoring probability (total >= 66.0 pts): 25.72%
Low scoring probability (total <= 38.0 pts): 44.55%

#2: Minnesota State Mankato (-9.00, 26.20%) at Minnesota Duluth (9.00, 73.80%)
Estimated score: 23.66 - 32.62, Total: 56.28
Quality: 76.80%, Team quality: 71.63%, Competitiveness: 88.29%
Blowout probability (margin >= 30.0 pts): 7.44%
Close game probability (margin <= 7.0 pts): 31.37%
High scoring probability (total >= 66.0 pts): 39.21%
Low scoring probability (total <= 38.0 pts): 30.33%

#3: CSU Pueblo (4.63, 62.87%) at Central Missouri (-4.63, 37.13%)
Estimated score: 40.24 - 35.61, Total: 75.85
Quality: 74.21%, Team quality: 64.99%, Competitiveness: 96.78%
Blowout probability (margin >= 30.0 pts): 4.70%
Close game probability (margin <= 7.0 pts): 36.12%
High scoring probability (total >= 66.0 pts): 60.93%
Low scoring probability (total <= 38.0 pts): 14.32%

#4: University Of Charleston (WV) (0.32, 50.90%) at West Alabama (-0.32, 49.10%)
Estimated score: 26.81 - 26.40, Total: 53.20
Quality: 72.97%, Team quality: 62.34%, Competitiveness: 99.98%
Blowout probability (margin >= 30.0 pts): 3.77%
Close game probability (margin <= 7.0 pts): 38.00%
High scoring probability (total >= 66.0 pts): 35.92%
Low scoring probability (total <= 38.0 pts): 33.42%

#5: Sioux Falls (-0.64, 48.20%) at Bemidji State (0.64, 51.80%)
Estimated score: 22.73 - 23.45, Total: 46.18
Quality: 70.99%, Team quality: 59.83%, Competitiveness: 99.94%
Blowout probability (margin >= 30.0 pts): 3.78%
Close game probability (margin <= 7.0 pts): 37.97%
High scoring probability (total >= 66.0 pts): 28.83%
Low scoring probability (total <= 38.0 pts): 40.89%

#6: Ashland (-9.36, 25.39%) at Indianapolis (9.36, 74.61%)
Estimated score: 21.15 - 30.55, Total: 51.71
Quality: 70.96%, Team quality: 63.94%, Competitiveness: 87.40%
Blowout probability (margin >= 30.0 pts): 7.74%
Close game probability (margin <= 7.0 pts): 30.90%
High scoring probability (total >= 66.0 pts): 34.36%
Low scoring probability (total <= 38.0 pts): 34.97%

#7: Nebraska-Kearney (-8.75, 26.78%) at Fort Hays State (8.75, 73.22%)
Estimated score: 21.26 - 29.88, Total: 51.14
Quality: 70.90%, Team quality: 63.32%, Competitiveness: 88.90%
Blowout probability (margin >= 30.0 pts): 7.23%
Close game probability (margin <= 7.0 pts): 31.71%
High scoring probability (total >= 66.0 pts): 33.78%
Low scoring probability (total <= 38.0 pts): 35.56%

#8: Delta State (5.13, 64.20%) at UNC Pembroke (-5.13, 35.80%)
Estimated score: 33.58 - 28.53, Total: 62.11
Quality: 68.65%, Team quality: 58.04%, Competitiveness: 96.06%
Blowout probability (margin >= 30.0 pts): 4.92%
Close game probability (margin <= 7.0 pts): 35.71%
High scoring probability (total >= 66.0 pts): 45.64%
Low scoring probability (total <= 38.0 pts): 24.85%

#9: Michigan Tech (12.34, 80.83%) at Hillsdale (-12.34, 19.17%)
Estimated score: 28.80 - 16.34, Total: 45.14
Quality: 68.06%, Team quality: 63.16%, Competitiveness: 79.02%
Blowout probability (margin >= 30.0 pts): 10.90%
Close game probability (margin <= 7.0 pts): 26.54%
High scoring probability (total >= 66.0 pts): 27.83%
Low scoring probability (total <= 38.0 pts): 42.03%

#10: Albany State GA (5.58, 65.38%) at Florida A&M (-5.58, 34.62%)
Estimated score: 29.26 - 23.65, Total: 52.90
Quality: 67.87%, Team quality: 57.26%, Competitiveness: 95.35%
Blowout probability (margin >= 30.0 pts): 5.13%
Close game probability (margin <= 7.0 pts): 35.30%
High scoring probability (total >= 66.0 pts): 35.61%
Low scoring probability (total <= 38.0 pts): 33.73%
Division III Predictions
#1: University of Mount Union (-4.29, 38.04%) at Grove City College (4.29, 61.96%)
Estimated score: 22.45 - 26.84, Total: 49.30
Quality: 79.91%, Team quality: 72.45%, Competitiveness: 97.22%
Blowout probability (margin >= 30.0 pts): 4.57%
Close game probability (margin <= 7.0 pts): 36.38%
High scoring probability (total >= 66.0 pts): 31.90%
Low scoring probability (total <= 38.0 pts): 37.52%

#2: Wisconsin-Lacrosse (7.96, 71.34%) at Carnegie Mellon (-7.96, 28.66%)
Estimated score: 25.11 - 17.10, Total: 42.21
Quality: 72.46%, Team quality: 64.74%, Competitiveness: 90.75%
Blowout probability (margin >= 30.0 pts): 6.60%
Close game probability (margin <= 7.0 pts): 32.72%
High scoring probability (total >= 66.0 pts): 25.13%
Low scoring probability (total <= 38.0 pts): 45.28%

#3: Wisconsin-Oshkosh (-19.65, 8.38%) at North Central College (19.65, 91.62%)
Estimated score: 17.61 - 37.03, Total: 54.64
Quality: 69.81%, Team quality: 79.16%, Competitiveness: 54.29%
Blowout probability (margin >= 30.0 pts): 23.25%
Close game probability (margin <= 7.0 pts): 15.40%
High scoring probability (total >= 66.0 pts): 37.45%
Low scoring probability (total <= 38.0 pts): 31.96%

#4: Wartburg (0.65, 51.85%) at Wisconsin-Stout (-0.65, 48.15%)
Estimated score: 27.44 - 26.85, Total: 54.29
Quality: 69.35%, Team quality: 57.77%, Competitiveness: 99.94%
Blowout probability (margin >= 30.0 pts): 3.78%
Close game probability (margin <= 7.0 pts): 37.97%
High scoring probability (total >= 66.0 pts): 37.07%
Low scoring probability (total <= 38.0 pts): 32.31%

#5: Coe College (-15.71, 13.41%) at Wisconsin-River Falls (15.71, 86.59%)
Estimated score: 23.41 - 39.16, Total: 62.58
Quality: 68.32%, Team quality: 68.49%, Competitiveness: 68.00%
Blowout probability (margin >= 30.0 pts): 15.77%
Close game probability (margin <= 7.0 pts): 21.27%
High scoring probability (total >= 66.0 pts): 46.16%
Low scoring probability (total <= 38.0 pts): 24.44%

#6: John Carroll University (-12.89, 18.13%) at Johns Hopkins University (12.89, 81.87%)
Estimated score: 16.81 - 29.47, Total: 46.28
Quality: 67.86%, Team quality: 63.59%, Competitiveness: 77.29%
Blowout probability (margin >= 30.0 pts): 11.61%
Close game probability (margin <= 7.0 pts): 25.68%
High scoring probability (total >= 66.0 pts): 28.92%
Low scoring probability (total <= 38.0 pts): 40.78%

#7: Randolph-Macon (-10.25, 23.41%) at Central College (10.25, 76.59%)
Estimated score: 18.65 - 28.93, Total: 47.58
Quality: 65.52%, Team quality: 57.51%, Competitiveness: 85.05%
Blowout probability (margin >= 30.0 pts): 8.59%
Close game probability (margin <= 7.0 pts): 29.65%
High scoring probability (total >= 66.0 pts): 30.19%
Low scoring probability (total <= 38.0 pts): 39.36%

#8: Case Western Reserve (-4.41, 37.72%) at Wabash College (4.41, 62.28%)
Estimated score: 28.83 - 32.92, Total: 61.75
Quality: 64.14%, Team quality: 52.14%, Competitiveness: 97.07%
Blowout probability (margin >= 30.0 pts): 4.61%
Close game probability (margin <= 7.0 pts): 36.29%
High scoring probability (total >= 66.0 pts): 45.23%
Low scoring probability (total <= 38.0 pts): 25.17%

#9: Westminster (PA) (-2.94, 41.74%) at Franklin & Marshall (2.94, 58.26%)
Estimated score: 14.42 - 17.41, Total: 31.83
Quality: 63.02%, Team quality: 50.36%, Competitiveness: 98.69%
Blowout probability (margin >= 30.0 pts): 4.14%
Close game probability (margin <= 7.0 pts): 37.23%
High scoring probability (total >= 66.0 pts): 16.79%
Low scoring probability (total <= 38.0 pts): 56.90%

#10: Hobart College (-10.44, 23.01%) at Brockport (10.44, 76.99%)
Estimated score: 7.75 - 18.29, Total: 26.05
Quality: 62.48%, Team quality: 53.72%, Competitiveness: 84.54%
Blowout probability (margin >= 30.0 pts): 8.77%
Close game probability (margin <= 7.0 pts): 29.38%
High scoring probability (total >= 66.0 pts): 13.02%
Low scoring probability (total <= 38.0 pts): 63.18%
These are high quality college football games, but I’d still like to see how the top teams at lower divisions really compare to FBS teams. There’s no substitute for actually playing those games, and I'd really like to see what would happen if North Central played a couple of games against Big Ten schools. One of the main reasons for some teams cancelling spring games was out of concern that other schools would use the opportunity to scout their players and encourage them to transfer. The change to a single transfer portal window in January should mitigate this concern. Why not play a couple of exhibition games against lower division schools in the spring, share the revenue with them, and give a real answer to my question?
Thanks for reading!
The ratings in this article are based on data from collegefootballdata.com.