


Week 16 NFL Computer Ratings and Predictions
Previewing a new approach to distributing team ratings and predictions

Before I post team ratings and game predictions, I'd like to discuss the future of these computer ratings and predictions. For awhile, I've been posting some of the tables as images and using Substack's "code blocks" for other tables. NFL predictions are formatted as bullet points in a big list. All of this gets the job done, but it's definitely not the best way for me to distribute data or for readers to visualize that data. I expect I'll continue to send NFL-related emails like this one for the remainder of the season, but not without also testing some upgrades to how I make my data available.
The team ratings and a lot of other metrics are calculated in a Python script that can take quite awhile to run. It's relatively fast, roughly three minutes of runtime on fairly old hardware for NFL ratings. That's because there just aren't that many NFL games, so my fourth-generation quad-core Core i5 can complete the processing somewhat quickly. But for a college football season, with far more games across all of the NCAA’s divisions, the processing can take about 40 minutes on the same hardware. But nearly all of that processing is spent on the predictive ratings. Anything else like strength of schedule or strength of record is calculated afterwards, and there's very little processing power required at all. That's also true for game predictions, which can be calculated just as easily with a lightweight JavaScript statistics library as with Python's SciPy stats functions.
I'm developing some JavaScript tools that will allow me to distribute the data as a JSON file, and then visualize the data on the fly in a web browser. I’ll still calculate the predictive ratings with my Python script as I do now. You'll still be able to access the raw data, because I’ll make the JSON file available. But instead of putting the ratings in long blocks of text or images of tables, you'll be able to view the team ratings in a dynamically-generated table and sort them interactively. Game predictions will be visualized in a manner that's inspired by election forecast graphics from the New York Times. This means you'll be able to generate predictions for any matchup, whether it's real or hypothetical, and it will be generated in your browser. I anticipate doing something similar with my 2025 baseball predictions in February, though that work isn’t nearly as far along in development. Here's an example of what game predictions will look like with a projection for the Tennessee-Ohio State college football playoff game:
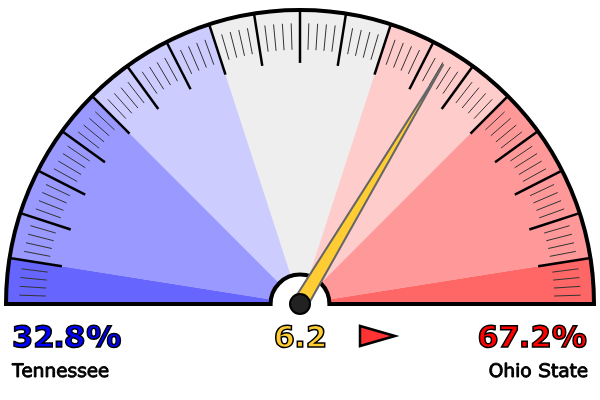
The graphic displays the win probability for both teams and the expected margin of victory, which is Ohio State by 6.2 points. You’ll be able to select any college football team, as well as choosing which team is home and which is away, or to choose a neutral site game. I don’t know the color schemes for all 134 FBS teams, let alone all 364 Division I college basketball teams or all the college football teams across the NCAA’s three divisions. Therefore, at least for now, I’ll probably keep the politically-inspired blue and red color scheme. The other metrics like the game quality and competitiveness will still be present, probably in the form of graphics that look like progress bars and also change colors depending on the percentage.
Unfortunately, I'm not aware of any way for me to directly embed these visualizations in a Substack newsletter. I'll probably set up a landing page for each sport with links to external sites that have the JavaScript applications. When I'm beta testing these applications, I'll probably self-host the JavaScript libraries and JSON files. As I move the JavaScript tools out of beta testing, I plan to move the data and libraries into the cloud, distributing them with a content delivery network. I'm looking into running the actual prediction code in the cloud as well to streamline the process. Moving the entire process into the cloud is probably a few months away, but I expect to begin beta testing some of these tools in the next couple of weeks.
Team Ratings
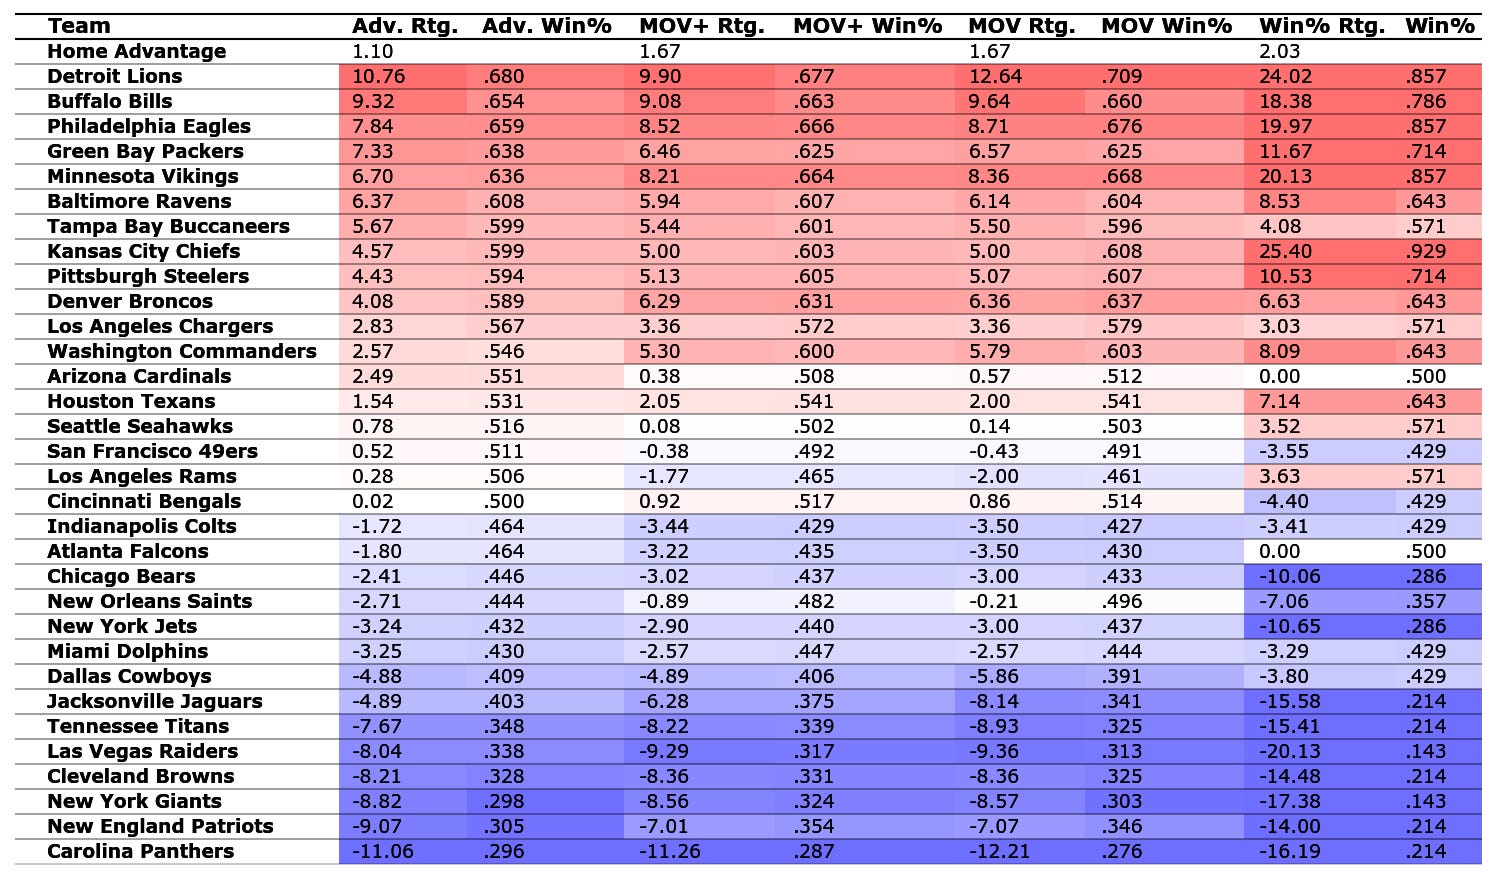
Here are updated NFL team rankings going into week 16, and predictions for this week.
As a reminder, the best predictor of a team's performance should be the advanced (Adv.) ratings, which accounts for margin of victory and the quality of a team's opponents. The MOV+ and MOV take into account margin of victory but do not factor in the strength of a team's schedule, so they should be a bit less accurate. Finally, the Win% ratings only take into account a team's whether a team won or lost their games, so this should be the least accurate predictor of a team's future performance.
I've posted a more detailed description about how the advanced ratings work in my recent article about college football ratings. The advanced rating for NFL teams is mostly the same as my predictive rating for college football teams. I could calculate a strength of record rating and combine them together like I do with my college football ratings, but schedule strengths are similar enough in the NFL that it's better to just look at the standings.
To calculate a the expected margin of victory for the home team, take the home team's rating, add the home advantage, and subtract the visiting team's rating. For a game played at a neutral site, just repeat the process but skip the step of adding the home advantage.
Schedule Strength
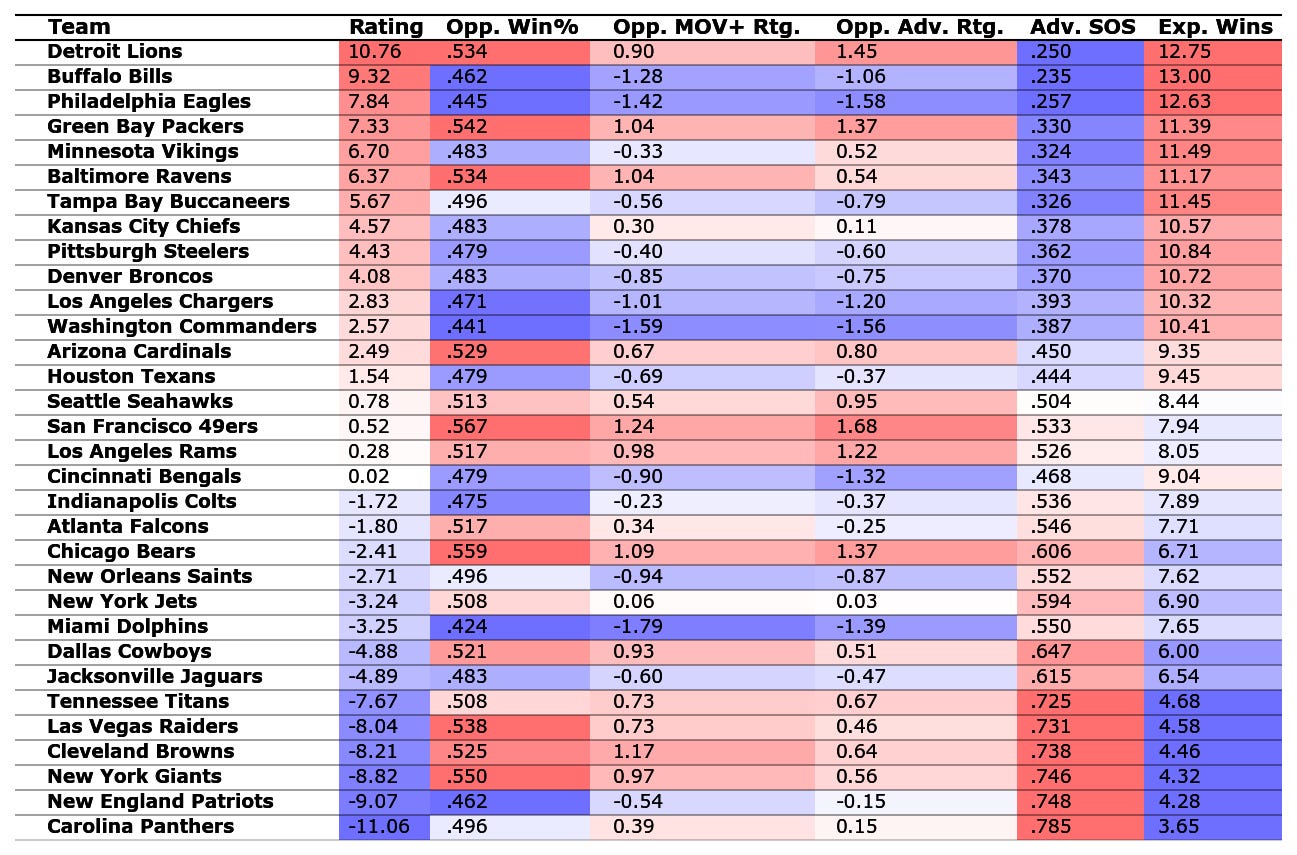
Unlike in college football, I'm calculating schedule strength for the entire schedule instead of just games that have already been played. The first column, "Rating" is a team's rating according to the advanced rating system. The second column, "Opp. Win%" is the average winning percentage of each team's opponents. The next column, "Opp. MOV+ Rtg." is the average of the team's opponents' ratings according to the MOV+ system, which is probably a bit less accurate than the advanced system. The "Opp. Adv. Rtg." is like the previous column, but averages the ratings of each team's opponents according to the advanced system, and should be more accurate. The differences are mostly small between the columns, but they are present.
The "Adv. SOS" column is the expected percentage of games that a team is expected to lose based on their advanced rating and the advanced rating of their opponents. This attempts to answer the question of how difficult a team's schedule is for that team. The "Exp. Wins" uses the "Adv. SOS" column to estimate the number of games each team would be expected to win over the course of the season.
Game Predictions
As always, the advanced ratings should be the most accurate predictor of future performance, but the other options are mainly here for comparison and later verification of the predictions.
Denver Broncos (DEN) at Los Angeles Chargers (LAC)
Winning percentage (Win%) forecast: DEN (2.37, 55.63%) | LAC (-2.37, 43.66%) | Tie (0.70%)
Unadjusted margin of victory (MOV) forecast: DEN (2.56, 56.25%) | LAC (-2.56, 43.35%) | Tie (0.40%)
Adjusted margin of victory (MOV+) forecast: DEN (2.49, 56.10%) | LAC (-2.49, 43.52%) | Tie (0.38%)
Advanced (Adv.) forecast: DEN (0.15, 50.27%) | LAC (-0.15, 49.21%) | Tie (0.52%)
Probability of competitive game: 53.68% | Competitive quality: 99.99% | Quality of teams: 72.34% | Game quality: 80.58%
Houston Texans (HOU) at Kansas City Chiefs (KC)
Winning percentage (Win%) forecast: HOU (-19.49, 14.64%) | KC (19.49, 85.10%) | Tie (0.26%)
Unadjusted margin of victory (MOV) forecast: HOU (-3.44, 41.16%) | KC (3.44, 58.45%) | Tie (0.39%)
Adjusted margin of victory (MOV+) forecast: HOU (-3.40, 41.29%) | KC (3.40, 58.34%) | Tie (0.37%)
Advanced (Adv.) forecast: HOU (-4.12, 36.02%) | KC (4.12, 63.52%) | Tie (0.46%)
Probability of competitive game: 50.43% | Competitive quality: 93.94% | Quality of teams: 67.79% | Game quality: 75.58%
Pittsburgh Steelers (PIT) at Baltimore Ravens (BAL)
Winning percentage (Win%) forecast: PIT (0.77, 51.59%) | BAL (-0.77, 47.69%) | Tie (0.72%)
Unadjusted margin of victory (MOV) forecast: PIT (-1.52, 45.95%) | BAL (1.52, 53.65%) | Tie (0.41%)
Adjusted margin of victory (MOV+) forecast: PIT (-1.25, 46.62%) | BAL (1.25, 52.99%) | Tie (0.39%)
Advanced (Adv.) forecast: PIT (-3.04, 39.43%) | BAL (3.04, 60.08%) | Tie (0.49%)
Probability of competitive game: 51.89% | Competitive quality: 96.66% | Quality of teams: 81.25% | Game quality: 86.09%
Arizona Cardinals (ARI) at Carolina Panthers (CAR)
Winning percentage (Win%) forecast: ARI (14.96, 80.12%) | CAR (-14.96, 19.52%) | Tie (0.36%)
Unadjusted margin of victory (MOV) forecast: ARI (12.34, 76.49%) | CAR (-12.34, 23.27%) | Tie (0.25%)
Adjusted margin of victory (MOV+) forecast: ARI (11.20, 74.64%) | CAR (-11.20, 25.10%) | Tie (0.26%)
Advanced (Adv.) forecast: ARI (12.46, 82.57%) | CAR (-12.46, 17.21%) | Tie (0.22%)
Probability of competitive game: 30.51% | Competitive quality: 56.84% | Quality of teams: 14.83% | Game quality: 23.20%
Detroit Lions (DET) at Chicago Bears (CHI)
Winning percentage (Win%) forecast: DET (27.83, 90.79%) | CHI (-27.83, 9.07%) | Tie (0.14%)
Unadjusted margin of victory (MOV) forecast: DET (15.20, 80.51%) | CHI (-15.20, 19.29%) | Tie (0.20%)
Adjusted margin of victory (MOV+) forecast: DET (12.47, 76.69%) | CHI (-12.47, 23.07%) | Tie (0.24%)
Advanced (Adv.) forecast: DET (12.06, 81.96%) | CHI (-12.06, 17.81%) | Tie (0.23%)
Probability of competitive game: 31.55% | Competitive quality: 58.78% | Quality of teams: 59.93% | Game quality: 59.54%
Los Angeles Rams (LAR) at New York Jets (NYJ)
Winning percentage (Win%) forecast: LAR (13.05, 77.47%) | NYJ (-13.05, 22.11%) | Tie (0.42%)
Unadjusted margin of victory (MOV) forecast: LAR (0.56, 51.21%) | NYJ (-0.56, 48.38%) | Tie (0.41%)
Adjusted margin of victory (MOV+) forecast: LAR (0.69, 51.56%) | NYJ (-0.69, 48.04%) | Tie (0.39%)
Advanced (Adv.) forecast: LAR (2.42, 58.03%) | NYJ (-2.42, 41.47%) | Tie (0.50%)
Probability of competitive game: 52.54% | Competitive quality: 97.87% | Quality of teams: 39.29% | Game quality: 53.26%
New York Giants (NYG) at Atlanta Falcons (ATL)
Winning percentage (Win%) forecast: NYG (-18.61, 15.47%) | ATL (18.61, 84.26%) | Tie (0.28%)
Unadjusted margin of victory (MOV) forecast: NYG (-5.52, 36.29%) | ATL (5.52, 63.34%) | Tie (0.37%)
Adjusted margin of victory (MOV+) forecast: NYG (-5.79, 35.68%) | ATL (5.79, 63.98%) | Tie (0.35%)
Advanced (Adv.) forecast: NYG (-8.11, 25.32%) | ATL (8.11, 74.34%) | Tie (0.34%)
Probability of competitive game: 42.08% | Competitive quality: 78.38% | Quality of teams: 14.83% | Game quality: 25.83%
Cleveland Browns (CLE) at Cincinnati Bengals (CIN)
Winning percentage (Win%) forecast: CLE (-11.31, 24.80%) | CIN (11.31, 74.73%) | Tie (0.47%)
Unadjusted margin of victory (MOV) forecast: CLE (-9.66, 27.78%) | CIN (9.66, 71.93%) | Tie (0.30%)
Adjusted margin of victory (MOV+) forecast: CLE (-9.72, 27.67%) | CIN (9.72, 72.05%) | Tie (0.28%)
Advanced (Adv.) forecast: CLE (-9.33, 22.69%) | CIN (9.33, 77.00%) | Tie (0.31%)
Probability of competitive game: 38.91% | Competitive quality: 72.49% | Quality of teams: 18.77% | Game quality: 29.45%
Tennessee Titans (TEN) at Indianapolis Colts (IND)
Winning percentage (Win%) forecast: TEN (-13.23, 21.85%) | IND (13.23, 77.73%) | Tie (0.41%)
Unadjusted margin of victory (MOV) forecast: TEN (-5.87, 35.49%) | IND (5.87, 64.15%) | Tie (0.36%)
Adjusted margin of victory (MOV+) forecast: TEN (-5.23, 36.95%) | IND (5.23, 62.70%) | Tie (0.35%)
Advanced (Adv.) forecast: TEN (-7.05, 27.86%) | IND (7.05, 71.76%) | Tie (0.38%)
Probability of competitive game: 44.67% | Competitive quality: 83.21% | Quality of teams: 18.10% | Game quality: 30.10%
Philadelphia Eagles (PHI) at Washington Commanders (WAS)
Winning percentage (Win%) forecast: PHI (10.65, 73.60%) | WAS (-10.65, 25.91%) | Tie (0.49%)
Unadjusted margin of victory (MOV) forecast: PHI (2.48, 56.08%) | WAS (-2.48, 43.52%) | Tie (0.40%)
Adjusted margin of victory (MOV+) forecast: PHI (2.78, 56.82%) | WAS (-2.78, 42.80%) | Tie (0.38%)
Advanced (Adv.) forecast: PHI (4.17, 63.66%) | WAS (-4.17, 35.88%) | Tie (0.46%)
Probability of competitive game: 50.35% | Competitive quality: 93.80% | Quality of teams: 79.37% | Game quality: 83.92%
Minnesota Vikings (MIN) at Seattle Seahawks (SEA)
Winning percentage (Win%) forecast: MIN (15.38, 80.66%) | SEA (-15.38, 18.99%) | Tie (0.35%)
Unadjusted margin of victory (MOV) forecast: MIN (7.77, 68.23%) | SEA (-7.77, 31.44%) | Tie (0.33%)
Adjusted margin of victory (MOV+) forecast: MIN (7.68, 68.07%) | SEA (-7.68, 31.62%) | Tie (0.32%)
Advanced (Adv.) forecast: MIN (4.82, 65.63%) | SEA (-4.82, 33.93%) | Tie (0.44%)
Probability of competitive game: 49.28% | Competitive quality: 91.80% | Quality of teams: 71.02% | Game quality: 77.36%
New England Patriots (NE) at Buffalo Bills (BUF)
Winning percentage (Win%) forecast: NE (-27.93, 9.03%) | BUF (27.93, 90.84%) | Tie (0.14%)
Unadjusted margin of victory (MOV) forecast: NE (-17.16, 17.01%) | BUF (17.16, 82.82%) | Tie (0.17%)
Adjusted margin of victory (MOV+) forecast: NE (-16.53, 17.71%) | BUF (16.53, 82.12%) | Tie (0.18%)
Advanced (Adv.) forecast: NE (-19.49, 9.76%) | BUF (19.49, 90.13%) | Tie (0.11%)
Probability of competitive game: 15.59% | Competitive quality: 29.04% | Quality of teams: 21.53% | Game quality: 23.79%
San Francisco 49ers (SF) at Miami Dolphins (MIA)
Winning percentage (Win%) forecast: SF (-1.49, 45.86%) | MIA (1.49, 53.43%) | Tie (0.71%)
Unadjusted margin of victory (MOV) forecast: SF (1.70, 54.11%) | MIA (-1.70, 45.49%) | Tie (0.40%)
Adjusted margin of victory (MOV+) forecast: SF (1.74, 54.23%) | MIA (-1.74, 45.38%) | Tie (0.39%)
Advanced (Adv.) forecast: SF (2.68, 58.87%) | MIA (-2.68, 40.63%) | Tie (0.49%)
Probability of competitive game: 52.29% | Competitive quality: 97.41% | Quality of teams: 39.91% | Game quality: 53.74%
Jacksonville Jaguars (JAX) at Las Vegas Raiders (LV)
Winning percentage (Win%) forecast: JAX (3.32, 57.99%) | LV (-3.32, 41.32%) | Tie (0.69%)
Unadjusted margin of victory (MOV) forecast: JAX (0.77, 51.75%) | LV (-0.77, 47.84%) | Tie (0.41%)
Adjusted margin of victory (MOV+) forecast: JAX (2.57, 56.30%) | LV (-2.57, 43.32%) | Tie (0.38%)
Advanced (Adv.) forecast: JAX (2.06, 56.82%) | LV (-2.06, 42.68%) | Tie (0.50%)
Probability of competitive game: 52.85% | Competitive quality: 98.46% | Quality of teams: 13.06% | Game quality: 25.60%
Tampa Bay Buccaneers (TB) at Dallas Cowboys (DAL)
Winning percentage (Win%) forecast: TB (6.65, 65.74%) | DAL (-6.65, 33.65%) | Tie (0.61%)
Unadjusted margin of victory (MOV) forecast: TB (10.91, 74.15%) | DAL (-10.91, 25.57%) | Tie (0.27%)
Adjusted margin of victory (MOV+) forecast: TB (9.88, 72.34%) | DAL (-9.88, 27.38%) | Tie (0.28%)
Advanced (Adv.) forecast: TB (9.44, 77.23%) | DAL (-9.44, 22.46%) | Tie (0.30%)
Probability of competitive game: 38.61% | Competitive quality: 71.92% | Quality of teams: 42.94% | Game quality: 50.99%
New Orleans Saints (NO) at Green Bay Packers (GB)
Winning percentage (Win%) forecast: NO (-19.96, 14.23%) | GB (19.96, 85.52%) | Tie (0.25%)
Unadjusted margin of victory (MOV) forecast: NO (-7.23, 32.55%) | GB (7.23, 67.11%) | Tie (0.34%)
Adjusted margin of victory (MOV+) forecast: NO (-7.80, 31.38%) | GB (7.80, 68.31%) | Tie (0.31%)
Advanced (Adv.) forecast: NO (-11.13, 19.32%) | GB (11.13, 80.42%) | Tie (0.26%)
Probability of competitive game: 34.05% | Competitive quality: 63.43% | Quality of teams: 51.15% | Game quality: 54.95%
This article uses data from Football Reference to generate these predictions. If you’d like to read more content like this, please click the subscribe button below. You can also support The Linked Letters by sharing this article on social media.