

Updated College Football Ratings and Mapping College Football
Why is it so challenging to accurately rate college football teams?


This weekend, it’s finally time to pack the stadiums or to sit on the couch and watch a full day of college football games. I’ll get to the updated ratings and my predictions for the best games of the weekend at the end of this article. First, I’d like to take a more detailed look at why rating college football teams is so challenging, especially compared to the NFL, NHL, and NBA. For this, I’m going to more closely examine about a topic I discussed in the last article: how and why some games are weighted differently in my rating system.
There are a few good reasons why some games might be weighted differently than others:
Preseason NFL games usually don't have the starters play a full four quarters. It means the outcomes are often more representative of a team's depth than the quality of their starters.
Older games probably should be weighted less. Just as the players in preseason games might not be representative of the players who will get the most playing time in regular season games, this is an issue when using games from the prior season. A team's roster almost certainly will have some turnover between seasons. Although the quality of teams from the prior season will usually have some value in predicting the current season, these games are less useful than those from the current season. There’s a case to be made that even older games within the same season should be weighted less, especially for a long season like MLB where team quality can change significantly due to injuries, trades, and other roster changes.
I also said that some games should be weighted higher or lower in college football because there aren't a lot of games between divisions, but those few interdivision games are very important for estimating the overall quality of the different divisions.
This last point is what I want to focus on, and it’s easier to explain visually than with text. To show this, I made a map of all the college football games in my data set from 2024. Each dot is a team. There are nearly 700 of them. In graph theory, these are referred to as nodes. Each line between dots in the image represents a game played between those two teams. Each game links two nodes together, and these links are called edges.
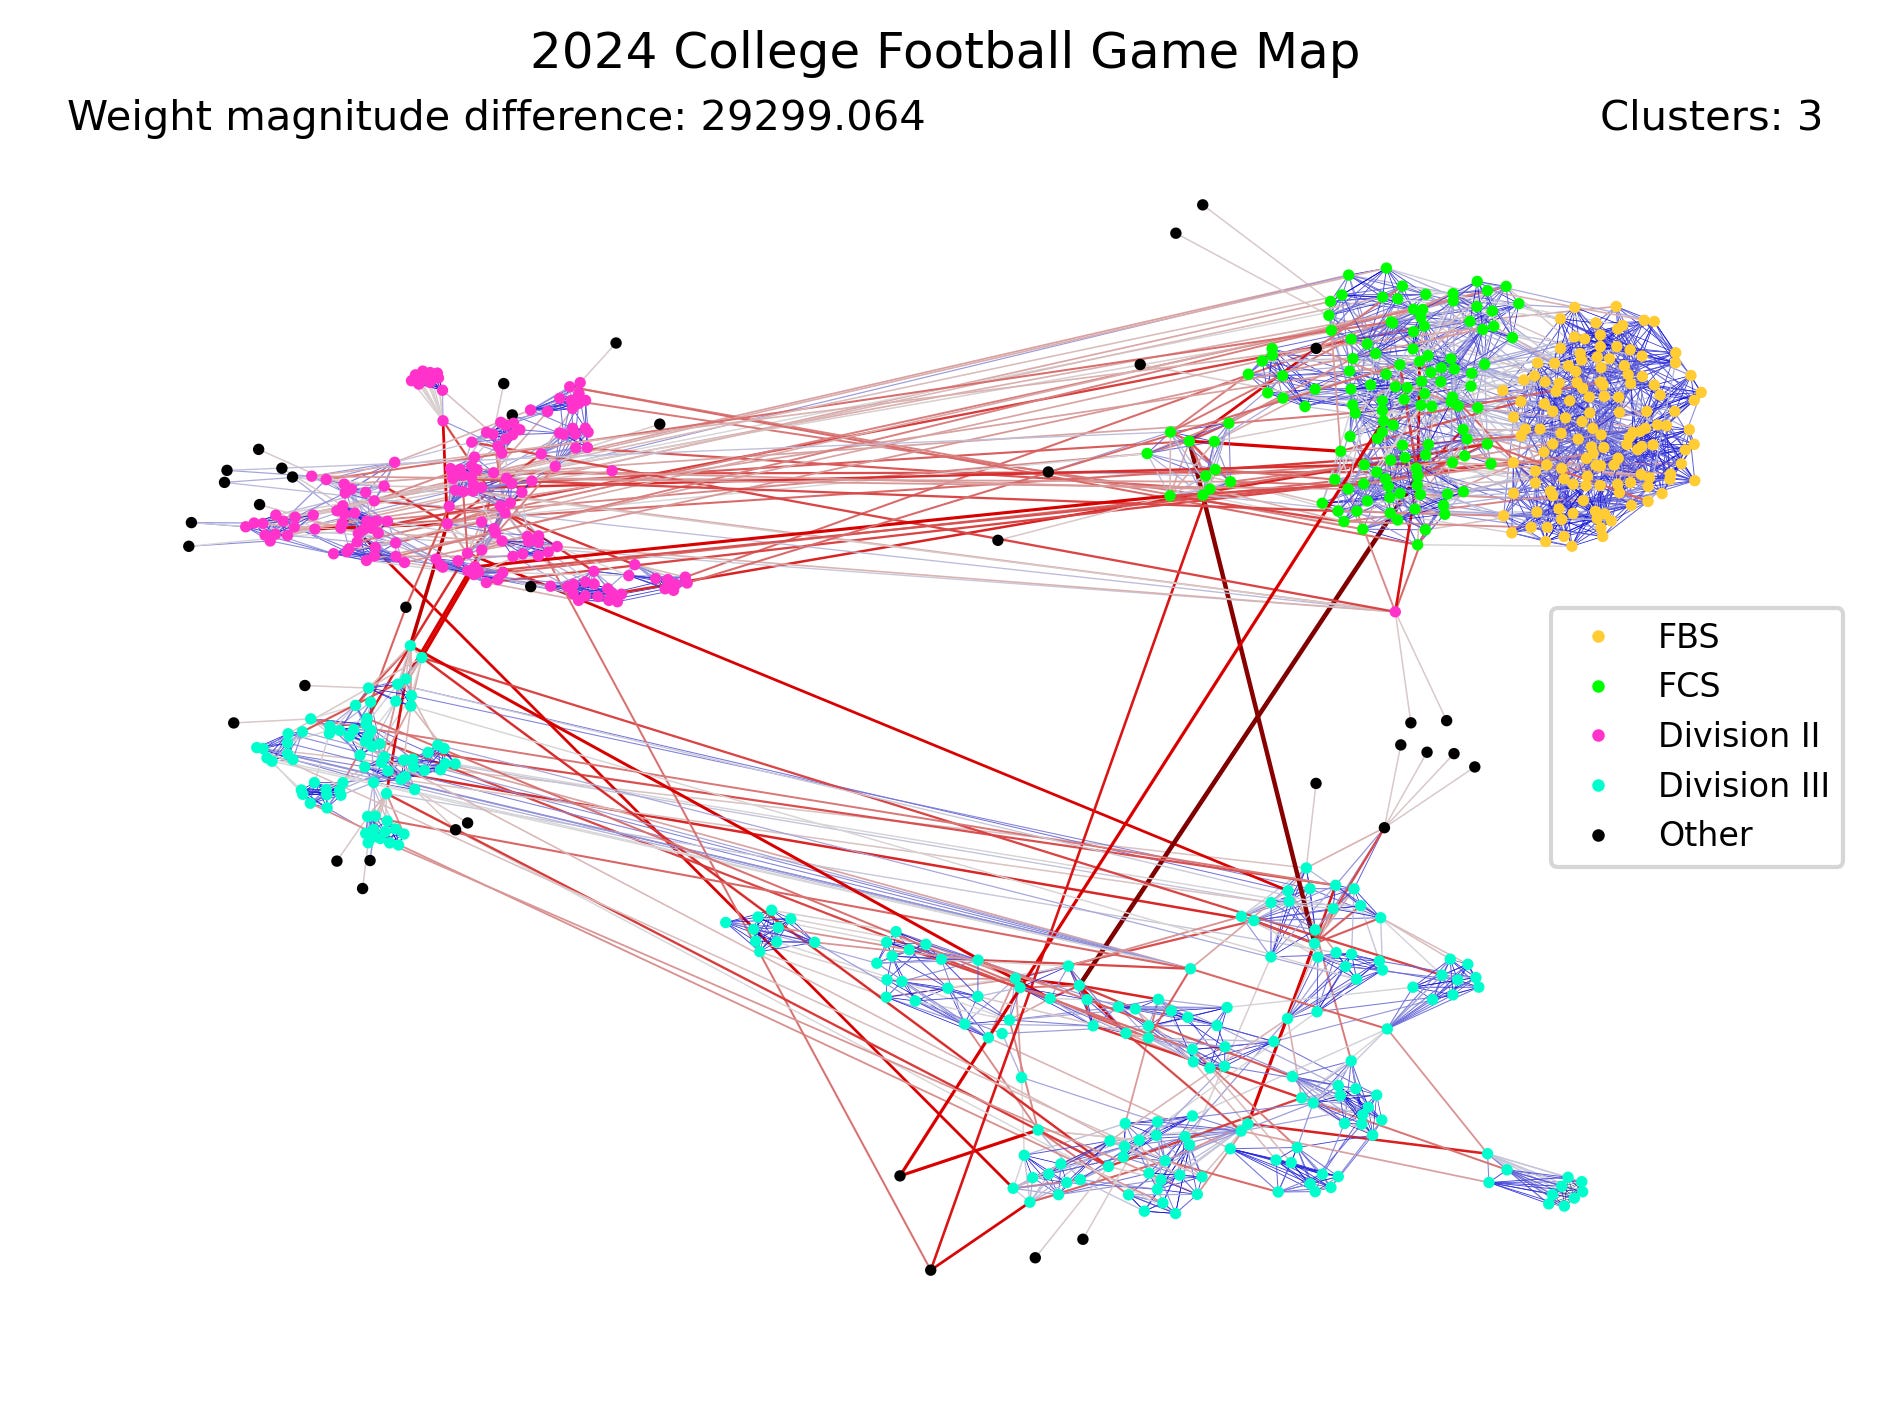
I've also color coded the nodes to indicate the division for each team. I'll explain later why the edges are also different colors and widths. Although FBS and FCS teams are separated on the graph, there are a lot of games played between those divisions. There are fewer games played between FCS and Division II teams, but there are still a lot of games connecting those teams. But there are very few games connecting higher divisions with Division III teams. Division III also seems to be split into two parts, with a relatively small number of games connecting the two clusters of teams. There are also clumps of teams in Division II and especially Division III teams, though a bit of this can also be seen for FCS teams. These clumps are conferences, and there just aren't as many non-conference games to connect the conferences at lower divisions.
The Principle of Rating Teams
If there are two teams, A and J, and they haven't played each other, how do we know which of those teams is probably better? If there's a common opponent, B, where A defeated B by three touchdowns, and B defeated J by four touchdowns, we can assume that A is a much better team than J. The teams are connected, where the graph is A-B-J. Perhaps our initial estimate is that A would win over J by seven touchdowns.
But we can improve our ratings of A and J if there are more connections. If A plays C, C plays D, and D plays J, then we have a less direct connection of A-C-D-J. If A wins over C by three touchdowns, C loses to D by a touchdown, and D wins by three touchdowns over J, this might suggest that A should win by five touchdowns over J. If A-B-J predicts that A is seven touchdowns better than J and A-C-D-J suggests A is five touchdowns better than J, maybe we split the difference and rate A as being six touchdowns better than J. This gives another point of comparison between A and J, and should make the rating more accurate. In this example, we've weighted the two connections A-B-J and A-C-D-J equally.
If we can add in more connections, like A-E-J, A-F-G-J, and A-H-I-J, each of these should improve the accuracy of the ratings. It also helps if there are other connections to compare the quality of the teams in the middle, like B-E, B-H, C-F, D-G, E-I, and G-H. All of these extra connections help us to more accurately rate A and J.
If we make a map of teams and there's a path that can be followed from A to J, then we say these teams are connected. If there's no possible path, then A and J would be unconnected. In order to rate teams, they have to be connected to each other. And if there are more connections, then the ratings will be more accurate.
Explaining the College Football Map
Visually, the map appears to have four clusters, the FBS/FCS cluster, the Division II cluster, and two clusters of Division III teams. Between each cluster, there are relatively few games. The only way to know the difference in quality between FBS and FCS teams is to have games that connect the teams from the two divisions. Fortunately, games between the FBS and FCS are relatively common, so there are many opportunities to compare the strength of the divisions. There are quite a few games between FCS and Division II teams, so there are many points of comparison as well. Despite the lack of FBS teams directly playing Division II opponents, it should still be reasonably accurate to compare them because both play many games against FCS opponents. We know FBS teams are stronger than their FCS counterparts, and we also have a fairly good measurement of the difference in quality between FCS and Division II teams.
This breaks down when we get to Division III, because games between Division III and other divisions are much rarer. The graph shows 12 connections between Division III and higher divisions, three of which are through a common opponent from outside both divisions. Those 12 connections are the only basis a rating system has to compare the quality of Division III teams to other divisions, and that makes the ratings inherently less accurate.
This map might be described as four islands of teams that are connected by bridges. Graph theory has a concept called edge betweenness centrality, which might be described as measuring how much an edge looks like a bridge between two different parts of the graph. As a reminder, the edges are the connections between two nodes, and each edge represents a game between two teams. There are lots of games between FCS and FBS teams, so games between those divisions generally don't look like bridges. However, there are only two direct matchups between FCS and Division III teams, so those games rate very highly in looking like bridges between the FBS/FCS island and one of the Division III islands. For games with a low edge betweenness centrality, meaning that they don't look like bridges between different parts of the map, they are plotted in blue and with a thin line. However, as edge betweenness centrality increases, I've made the lines thicker, and their color shifts toward darker shades of red.
According to my ratings, the widest range of quality between the best and worst teams is in Division III, and it's not close. For FBS, it's 68.12 points. In FCS, that increases slightly to 71.75. In Division II, the difference is 97.7 points. And in Division III, that rises all the way to 134.72 points. The top team in Division III is North Central College, which has a rating of 32.11 points and is ranked ahead of 23 FBS teams. Is this accurate? I don't know, just because FBS teams don't play Division II or III opponents in modern college football. I don't doubt the ratings of FCS teams like South Dakota State (50.88), North Dakota State (50.14), or Montana State (47.09) because there are many opportunities to compare the strength of the FBS and FCS. Even Division II's Ferris State (40.73), Harding University (36.44), and Valdosta State (26.12) are probably fairly accurate because of the 37 games between FCS and Division II teams. It's much harder to know just how good the top Division III teams are because the division isn't that well connected to itself, and there are just so few connections to higher divisions.
Mapping NFL Games
By comparison, the map of NFL games looks much different. The algorithm divides the NFL into two clusters, which makes sense because there are two conferences. However, the map looks a lot like a really large college football conference that's split into two divisions. There are lots of common opponents between the two conferences, and there aren't any parts of the map that look like islands. A few of the games are colored in blue instead of red, but these tend to be games within divisions, where each team plays every other team in the division twice.
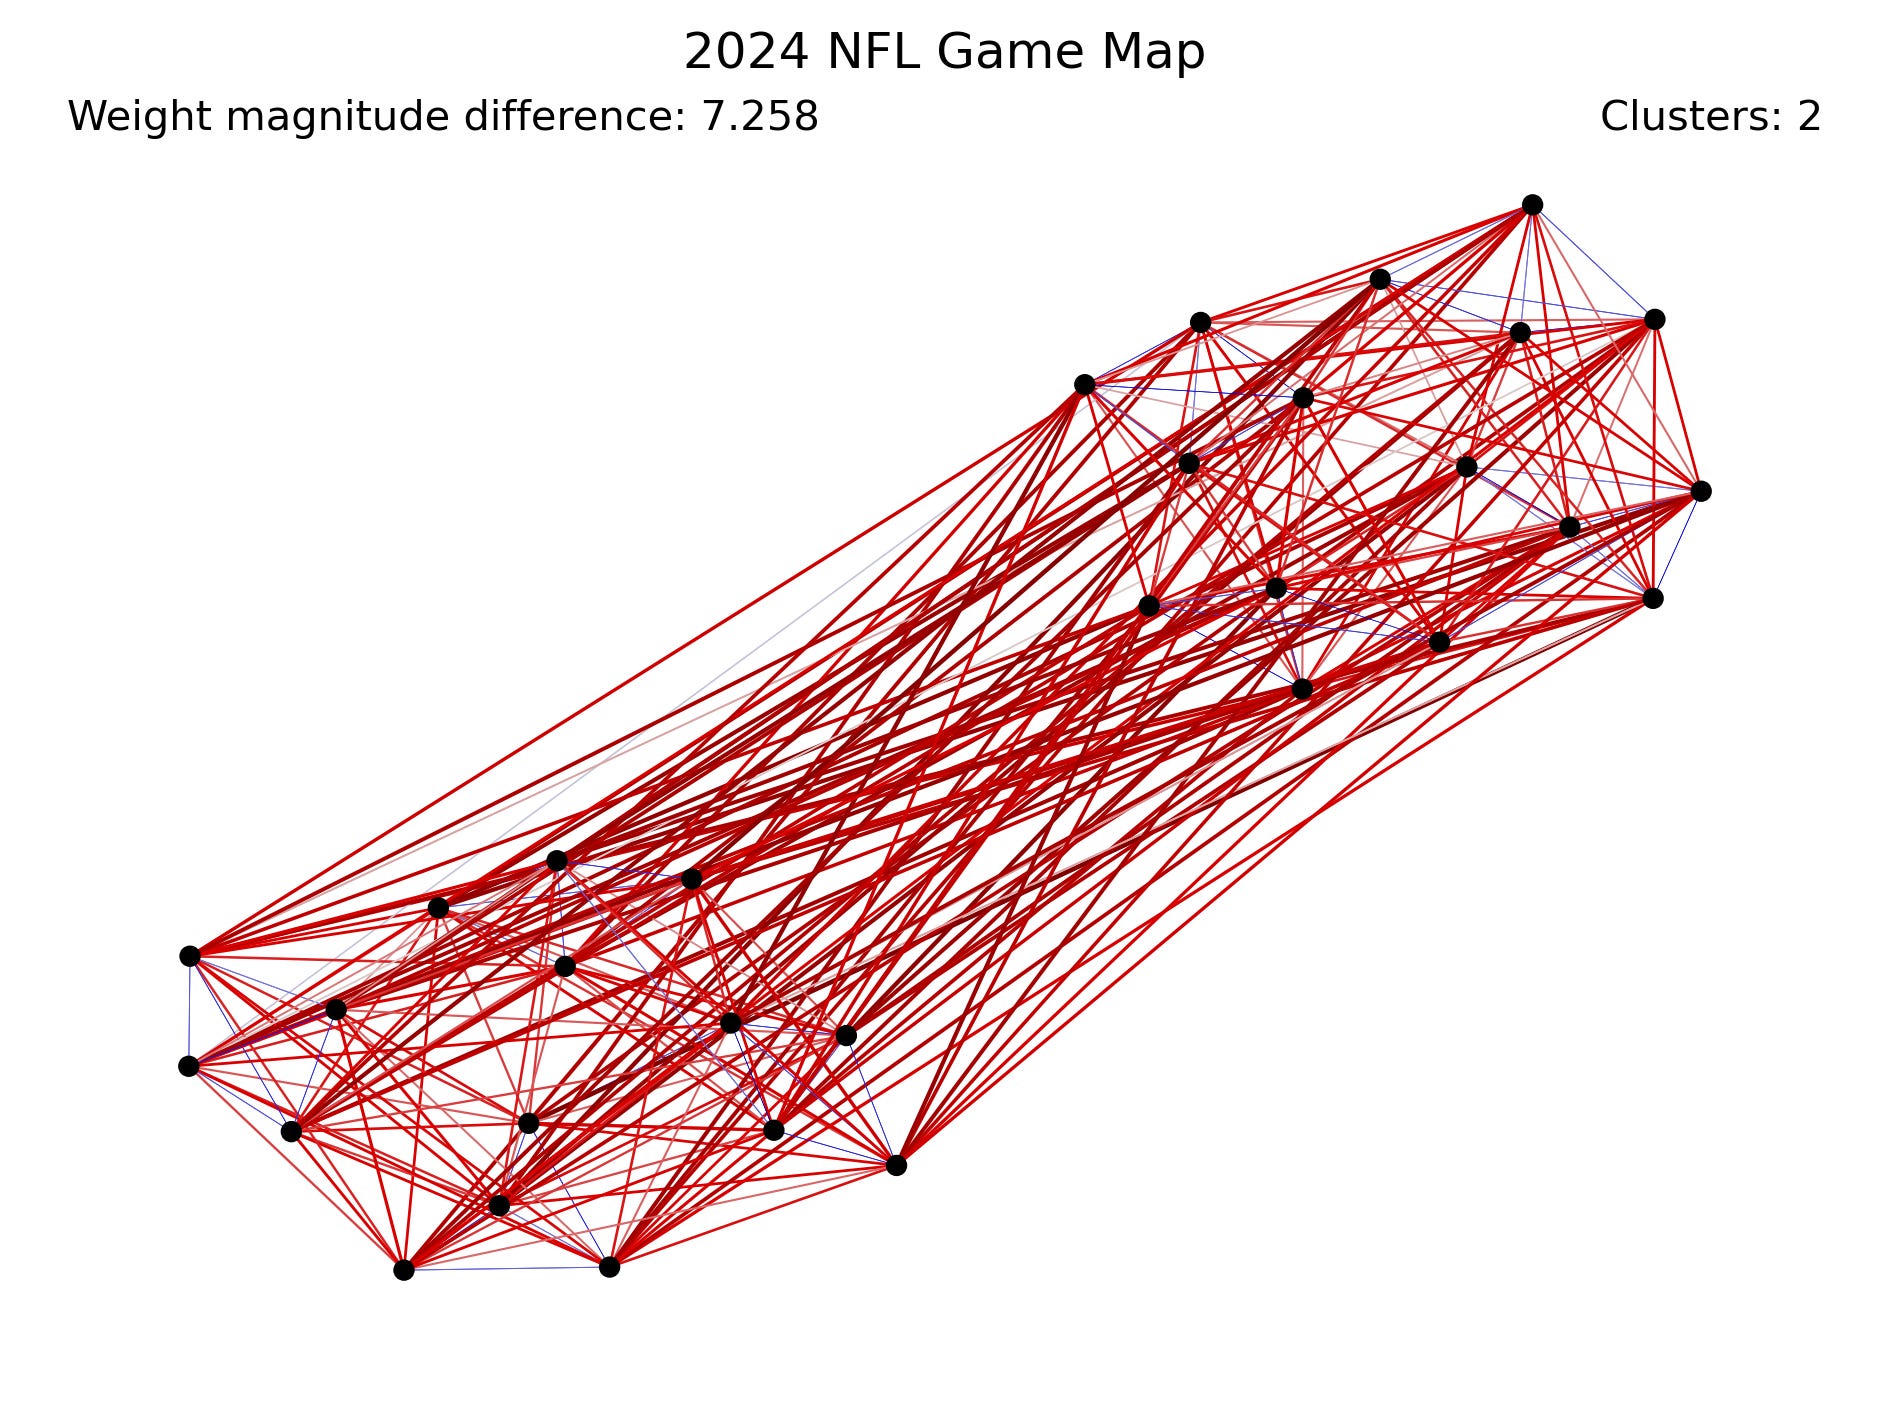
The weight magnitude difference is a measure of how much larger the highest edge betweenness centrality on the map is compared to the lowest value. For the NFL map, the highest edge betweenness centrality is about 7.26 times as large as the lowest value. By comparison, the highest edge betweenness centarlity in college football is roughly 29,299 times as large as the lowest value on the graph. It's highest for the two direct matchups between FCS and Division III teams. In both cases, the graphs are connected, meaning that you can find a series of common opponents between any two teams. But college football teams, especially at lower divisions, aren't nearly as well-connected as NFL teams are. And that presents a significant challenge for accurately rating college football teams.
For now, I've given games with a higher edge betweenness centrality more weight in the ratings, making it a priority to accurately predict the results of those games. This leads to a more realistic rating of Division III teams against their counterparts in higher divisions. I am still developing this rating system, so it's quite possible I'll refine this in the future or perhaps adopt a different approach altogether. The map shows why it's so challenging to accurately rank teams between divisions, especially when Division III teams are included.
According to my ratings, the widest range of quality between the best and worst teams is in Division III, and it's not close. For FBS, it's 68.12 points. In FCS, that increases slightly to 71.75. In Division II, the difference is 97.7 points. And in Division III, that rises all the way to 134.72 points. The top team in Division III is North Central College, which has a rating of 32.11 points and is ranked ahead of 23 FBS teams. Is this accurate? I don't know, just because FBS teams don't play Division II or III opponents in modern college football. I don't doubt the ratings of FCS teams like South Dakota State (50.88), North Dakota State (50.14), or Montana State (47.09) because there are many opportunities to compare the strength of the FBS and FCS. Even Division II's Ferris State (40.73), Harding University (36.44), and Valdosta State (26.12) are probably somewhat accurate for comparison to the FBS because there are 37 games between FCS and Division II teams.
So what would happen if North Central College played Kent State, with a rating of 9.15? I wish I had a confident answer to the question, but it’s definitely intriguing. Unfortunately, scheduling just makes it much harder to know just how good the top Division III teams are because the division isn't that well connected to itself, and there are just so few connections to higher divisions.
Updated Ratings
Despite experimenting with a few tweaks to the rating system, I've decided to stick with my algorithm for now. Here are my updated ratings following the five FBS games played last weekend.
As a reminder, these ratings are almost entirely based on the results from the 2024 season. Those games are currently weighted at 100% of the value of 2025 games. After a couple of weeks of the season, I’ll start to lower the weighting of 2024 games. With more results from the 2025 season, these ratings quickly become a more accurate estimate of which teams are best right now.
Overall Ratings
Home advantage: 3.11 points
Mean score: 26.35 points
Rank Rating Team                  Offense Defense
   1 77.27  Ohio State            37.03   40.24
   2 73.86  Notre Dame            37.19   36.67
   3 72.48  Ole Miss              36.38   36.06
   4 72.45  Texas                 34.46   37.99
   5 71.10  Indiana               38.26   32.93
   6 70.35  Alabama               35.63   34.70
   7 69.18  Tennessee             34.12   35.09
   8 69.00  Penn State            32.79   36.27
   9 68.63  Georgia               34.22   34.35
  10 67.14  Oregon                35.65   31.55
  11 65.75  South Carolina        31.20   34.50
  12 64.25  Miami                 40.23   24.00
  13 63.17  Louisville            34.81   28.55
  14 62.75  Arizona State         32.25   30.54
  15 62.40  SMU                   34.21   28.15
  16 61.80  BYU                   30.06   31.74
  17 61.61  LSU                   32.12   29.52
  18 61.36  Colorado              31.81   29.36
  19 61.27  USC                   32.26   29.07
  20 61.07  Florida               29.53   31.62
Rank Rating Team                  Offense Defense
  21 60.82  Texas A&M             30.52   30.17
  22 60.68  Clemson               33.00   27.70
  23 60.11  Minnesota             25.97   34.04
  24 59.58  Iowa                  28.76   30.94
  25 59.49  Iowa State            28.85   30.67
  26 58.63  Baylor                33.58   25.03
  27 58.52  Kansas State          29.58   29.00
  28 58.42  Michigan              24.49   33.88
  29 58.21  Kansas                29.57   28.53
  30 57.36  Missouri              26.24   31.01
  31 57.13  Virginia Tech         26.78   30.33
  32 56.94  Oklahoma              25.84   31.07
  33 56.70  Tulane                29.62   27.15
  34 55.78  Boise State           30.56   25.14
  35 55.56  Vanderbilt            26.99   28.38
  36 55.50  TCU                   29.79   25.92
  37 55.36  Arkansas              28.37   27.05
  38 55.15  Auburn                25.69   29.32
  39 54.83  Illinois              27.33   27.49
  40 54.15  UCF                   30.31   23.83
Rank Rating Team                  Offense Defense
  41 54.10  Nebraska              21.80   32.06
  42 53.24  Georgia Tech          26.57   26.74
  43 53.09  Utah                  20.94   32.11
  44 52.55  Washington            23.14   29.53
  45 52.29  Texas Tech            33.70   18.34
  46 52.20  Wisconsin             22.89   29.31
  47 52.04  UNLV                  27.61   24.43
  48 51.83  Boston College        25.80   26.05
  49 51.74  Army                  22.38   29.44
  50 51.71  Syracuse              30.26   21.29
  51 51.69  Cincinnati            23.82   27.87
  52 51.60  Kentucky              20.89   30.68
  53 51.02  Rutgers               28.10   22.84
  54 49.90  Pittsburgh            27.70   22.16
  55 49.72  Navy                  25.16   24.66
  56 49.58  UCLA                  21.25   28.33
  57 49.19  Marshall              25.12   24.06
  58 48.10  Duke                  22.28   25.60
  59 48.02  Texas State           27.39   20.60
  60 47.97  California            20.13   27.85
Rank Rating Team                  Offense Defense
  61 47.88  Memphis               26.27   21.60
  62 47.34  West Virginia         26.59   20.78
  63 47.19  James Madison         22.76   24.35
  64 46.69  Mississippi State     27.25   19.58
  65 46.51  North Carolina        26.79   19.67
  66 45.74  Ohio                  19.71   26.04
  67 45.67  Maryland              24.72   20.96
  68 45.00  Virginia              20.48   24.50
  69 44.77  Washington State      27.58   17.20
  70 44.40  Houston               14.87   29.64
  71 44.22  Oklahoma State        25.76   18.51
  72 43.94  Old Dominion          22.80   21.14
  73 43.92  South Alabama         24.03   19.86
  74 43.67  UConn                 21.78   21.94
  75 43.50  Miami (OH)            17.23   26.07
  76 43.30  NC State              24.36   18.72
  77 42.96  Northwestern          18.30   24.72
  78 42.85  Louisiana             21.80   21.05
  79 42.66  Jacksonville State    26.71   15.88
  80 42.55  Michigan State        17.19   25.23
Rank Rating Team                  Offense Defense
  81 42.53  Georgia Southern      21.87   20.70
  82 41.91  Northern Illinois     14.33   27.56
  83 41.09  Toledo                20.17   20.95
  84 40.96  Bowling Green         18.33   22.65
  85 40.54  Arizona               19.95   20.59
  86 39.82  South Florida         22.76   17.10
  87 38.94  Fresno State          18.31   20.69
  88 38.88  Stanford              19.98   18.80
  89 38.66  Florida State         14.04   24.74
  90 38.65  UTSA                  23.36   15.26
  91 38.61  East Carolina         21.05   17.56
  92 38.60  Wake Forest           21.09   17.53
  93 38.43  North Texas           25.19   13.10
  94 37.59  San José State        20.20   17.29
  95 37.05  Western Kentucky      17.83   19.34
  96 36.81  Sam Houston           15.17   21.66
  97 36.28  App State             20.56   15.84
  98 35.96  Coastal Carolina      20.86   15.15
  99 35.72  Nevada                17.23   18.42
 100 35.31  Buffalo               18.63   16.63
Rank Rating Team                  Offense Defense
 101 35.26  Rice                  15.04   20.38
 102 35.16  Troy                  17.69   17.38
 103 34.94  Colorado State        16.11   18.88
 104 34.51  Oregon State          17.00   17.36
 105 33.73  UL Monroe             14.76   18.98
 106 33.63  Western Michigan      20.47   13.12
 107 33.44  Florida International 15.50   17.94
 108 33.34  Liberty               15.63   17.61
 109 32.83  Air Force             11.16   21.72
 110 32.79  Georgia State         18.00   14.64
 111 32.53  Utah State            24.93   7.62
 112 32.49  New Mexico            25.93   6.62
 113 32.36  Wyoming               11.62   20.80
 114 31.93  Arkansas State        17.99   13.81
 115 31.66  Louisiana Tech        10.28   21.35
 116 31.14  Hawai'i               11.38   19.78
 117 30.90  Charlotte             17.06   13.87
 118 30.64  Eastern Michigan      15.85   14.63
 119 30.46  UAB                   18.62   11.94
 120 29.73  Purdue                17.64   12.05
Rank Rating Team                  Offense Defense
 121 29.38  Missouri State        19.42   10.03
 122 28.96  Florida Atlantic      15.58   13.36
 123 28.75  Central Michigan      15.05   13.70
 124 28.74  Akron                 14.40   14.20
 125 27.74  San Diego State       12.16   15.64
 126 27.27  Delaware              16.19   11.08
 127 25.41  Ball State            18.68   6.70
 128 24.94  Massachusetts         16.41   8.58
 129 24.77  Temple                11.37   13.47
 130 21.90  UTEP                  11.97   10.06
 131 19.53  Middle Tennessee      10.01   9.36
 132 19.51  New Mexico State      12.05   7.44
 133 19.15  Kennesaw State        6.85    12.43
 134 17.90  Southern Miss         8.69    9.30
 135 14.54  Tulsa                 13.18   1.31
 136 9.15   Kent State            7.47    1.88
Game Predictions
There are a lot of games with FBS teams in week 1 just because there are frequent games against FCS competition early in the season. The games are listed in order of their expected quality, not the start time. This is my attempt to identify the most compelling matchups each weekend.
After the team name, there are two numbers. The first is the team’s expected margin of victory (positive) or defeat (negative). The second number is the team’s probability of winning the game.
The estimated score is based on the offense and defense ratings and may not exactly match up with the predicted margin of victory, though it’s very close. The main idea is to give a rough approximation of what score might be expected based on the quality of the two teams, and whether it will be a high or low scoring game.
I try to estimate the quality of the game based on the ratings of the two teams and the likelihood of a competitive game. This is maximized when two highly-rated teams play and are evenly matched. Finally, I show the probability of a blowout, a close game, a high scoring game, and a low scoring game, with the thresholds based on previous games used to train the rating system.
#1: LSU (-2.18, 42.93%) at Clemson (2.18, 57.07%)
Estimated score: 29.21 - 31.38, Total: 60.58
Quality: 97.58%, Team quality: 96.78%, Competitiveness: 99.20%
Blowout probability (margin >= 34.0 pts): 0.62%
Close game probability (margin <= 8.5 pts): 50.55%
High scoring probability (total >= 79.0 pts): 30.62%
Low scoring probability (total <= 26.3 pts): 17.37%

#2: Notre Dame (6.50, 70.21%) at Miami (-6.50, 29.79%)
Estimated score: 37.98 - 31.46, Total: 69.44
Quality: 96.40%, Team quality: 98.12%, Competitiveness: 93.06%
Blowout probability (margin >= 34.0 pts): 1.28%
Close game probability (margin <= 8.5 pts): 45.46%
High scoring probability (total >= 79.0 pts): 39.60%
Low scoring probability (total <= 26.3 pts): 11.84%

#3: Nebraska (2.42, 57.82%) vs. Cincinnati (-2.42, 42.18%)
Estimated score: 20.28 - 18.11, Total: 38.39
Quality: 95.99%, Team quality: 94.51%, Competitiveness: 99.02%
Blowout probability (margin >= 34.0 pts): 0.64%
Close game probability (margin <= 8.5 pts): 50.40%
High scoring probability (total >= 79.0 pts): 13.22%
Low scoring probability (total <= 26.3 pts): 37.05%

#4: Utah (0.40, 51.30%) at UCLA (-0.40, 48.70%)
Estimated score: 17.40 - 17.04, Total: 34.44
Quality: 95.94%, Team quality: 93.98%, Competitiveness: 99.97%
Blowout probability (margin >= 34.0 pts): 0.55%
Close game probability (margin <= 8.5 pts): 51.22%
High scoring probability (total >= 79.0 pts): 11.04%
Low scoring probability (total <= 26.3 pts): 41.21%

#5: Texas (-7.93, 25.87%) at Ohio State (7.93, 74.13%)
Estimated score: 19.01 - 26.95, Total: 45.96
Quality: 95.68%, Team quality: 98.77%, Competitiveness: 89.79%
Blowout probability (margin >= 34.0 pts): 1.69%
Close game probability (margin <= 8.5 pts): 42.87%
High scoring probability (total >= 79.0 pts): 18.19%
Low scoring probability (total <= 26.3 pts): 29.52%

#6: Auburn (-6.60, 29.50%) at Baylor (6.60, 70.50%)
Estimated score: 25.45 - 32.15, Total: 57.60
Quality: 94.71%, Team quality: 95.66%, Competitiveness: 92.85%
Blowout probability (margin >= 34.0 pts): 1.31%
Close game probability (margin <= 8.5 pts): 45.29%
High scoring probability (total >= 79.0 pts): 27.81%
Low scoring probability (total <= 26.3 pts): 19.54%

#7: TCU (5.88, 68.44%) at North Carolina (-5.88, 31.56%)
Estimated score: 34.92 - 28.78, Total: 63.69
Quality: 93.95%, Team quality: 93.78%, Competitiveness: 94.29%
Blowout probability (margin >= 34.0 pts): 1.14%
Close game probability (margin <= 8.5 pts): 46.46%
High scoring probability (total >= 79.0 pts): 33.67%
Low scoring probability (total <= 26.3 pts): 15.27%

#8: Virginia Tech (-8.63, 24.06%) vs. South Carolina (8.63, 75.94%)
Estimated score: 18.63 - 27.22, Total: 45.85
Quality: 93.73%, Team quality: 96.73%, Competitiveness: 88.00%
Blowout probability (margin >= 34.0 pts): 1.94%
Close game probability (margin <= 8.5 pts): 41.49%
High scoring probability (total >= 79.0 pts): 18.11%
Low scoring probability (total <= 26.3 pts): 29.62%

#9: Georgia Southern (0.47, 51.52%) at Fresno State (-0.47, 48.48%)
Estimated score: 25.97 - 25.52, Total: 51.49
Quality: 92.59%, Team quality: 89.11%, Competitiveness: 99.96%
Blowout probability (margin >= 34.0 pts): 0.55%
Close game probability (margin <= 8.5 pts): 51.21%
High scoring probability (total >= 79.0 pts): 22.47%
Low scoring probability (total <= 26.3 pts): 24.50%

#10: Ohio (-8.39, 24.66%) at Rutgers (8.39, 75.34%)
Estimated score: 21.65 - 29.96, Total: 51.62
Quality: 91.29%, Team quality: 92.66%, Competitiveness: 88.62%
Blowout probability (margin >= 34.0 pts): 1.85%
Close game probability (margin <= 8.5 pts): 41.97%
High scoring probability (total >= 79.0 pts): 22.58%
Low scoring probability (total <= 26.3 pts): 24.39%

#11: Georgia Tech (-11.23, 17.95%) at Colorado (11.23, 82.05%)
Estimated score: 22.00 - 32.97, Total: 54.97
Quality: 90.22%, Team quality: 95.62%, Competitiveness: 80.32%
Blowout probability (margin >= 34.0 pts): 3.16%
Close game probability (margin <= 8.5 pts): 35.81%
High scoring probability (total >= 79.0 pts): 25.44%
Low scoring probability (total <= 26.3 pts): 21.60%

#12: East Carolina (-7.80, 26.20%) at NC State (7.80, 73.80%)
Estimated score: 27.11 - 34.70, Total: 61.81
Quality: 89.40%, Team quality: 89.05%, Competitiveness: 90.10%
Blowout probability (margin >= 34.0 pts): 1.65%
Close game probability (margin <= 8.5 pts): 43.12%
High scoring probability (total >= 79.0 pts): 31.81%
Low scoring probability (total <= 26.3 pts): 16.52%

#13: App State (5.37, 66.96%) vs. Charlotte (-5.37, 33.04%)
Estimated score: 33.03 - 27.57, Total: 60.60
Quality: 87.88%, Team quality: 84.43%, Competitiveness: 95.21%
Blowout probability (margin >= 34.0 pts): 1.04%
Close game probability (margin <= 8.5 pts): 47.22%
High scoring probability (total >= 79.0 pts): 30.63%
Low scoring probability (total <= 26.3 pts): 17.36%

#14: Wyoming (0.51, 51.65%) at Akron (-0.51, 48.35%)
Estimated score: 22.21 - 21.50, Total: 43.71
Quality: 87.76%, Team quality: 82.23%, Competitiveness: 99.96%
Blowout probability (margin >= 34.0 pts): 0.55%
Close game probability (margin <= 8.5 pts): 51.20%
High scoring probability (total >= 79.0 pts): 16.60%
Low scoring probability (total <= 26.3 pts): 31.68%

#15: Miami (OH) (-11.81, 16.75%) at Wisconsin (11.81, 83.25%)
Estimated score: 12.72 - 24.72, Total: 37.44
Quality: 87.40%, Team quality: 92.26%, Competitiveness: 78.44%
Blowout probability (margin >= 34.0 pts): 3.51%
Close game probability (margin <= 8.5 pts): 34.49%
High scoring probability (total >= 79.0 pts): 12.67%
Low scoring probability (total <= 26.3 pts): 38.04%

#16: California (10.35, 80.10%) at Oregon State (-10.35, 19.90%)
Estimated score: 27.56 - 17.05, Total: 44.61
Quality: 87.03%, Team quality: 89.07%, Competitiveness: 83.08%
Blowout probability (margin >= 34.0 pts): 2.69%
Close game probability (margin <= 8.5 pts): 37.81%
High scoring probability (total >= 79.0 pts): 17.23%
Low scoring probability (total <= 26.3 pts): 30.81%

#17: Boise State (12.85, 85.29%) at South Florida (-12.85, 14.71%)
Estimated score: 38.24 - 25.52, Total: 63.77
Quality: 86.02%, Team quality: 92.18%, Competitiveness: 74.90%
Blowout probability (margin >= 34.0 pts): 4.21%
Close game probability (margin <= 8.5 pts): 32.07%
High scoring probability (total >= 79.0 pts): 33.75%
Low scoring probability (total <= 26.3 pts): 15.21%

#18: UNLV (12.12, 83.88%) at Sam Houston (-12.12, 16.12%)
Estimated score: 30.74 - 18.64, Total: 49.38
Quality: 85.99%, Team quality: 90.64%, Competitiveness: 77.40%
Blowout probability (margin >= 34.0 pts): 3.71%
Close game probability (margin <= 8.5 pts): 33.77%
High scoring probability (total >= 79.0 pts): 20.78%
Low scoring probability (total <= 26.3 pts): 26.36%

#19: Rice (-10.70, 19.11%) at Louisiana (10.70, 80.89%)
Estimated score: 18.78 - 29.33, Total: 48.11
Quality: 85.80%, Team quality: 87.77%, Competitiveness: 82.00%
Blowout probability (margin >= 34.0 pts): 2.87%
Close game probability (margin <= 8.5 pts): 37.02%
High scoring probability (total >= 79.0 pts): 19.79%
Low scoring probability (total <= 26.3 pts): 27.51%

#20: Coastal Carolina (-12.15, 16.06%) at Virginia (12.15, 83.94%)
Estimated score: 21.15 - 33.23, Total: 54.38
Quality: 84.61%, Team quality: 88.51%, Competitiveness: 77.30%
Blowout probability (margin >= 34.0 pts): 3.73%
Close game probability (margin <= 8.5 pts): 33.70%
High scoring probability (total >= 79.0 pts): 24.92%
Low scoring probability (total <= 26.3 pts): 22.08%

#21: Toledo (-13.62, 13.30%) at Kentucky (13.62, 86.70%)
Estimated score: 14.28 - 27.84, Total: 42.12
Quality: 84.52%, Team quality: 91.47%, Competitiveness: 72.17%
Blowout probability (margin >= 34.0 pts): 4.81%
Close game probability (margin <= 8.5 pts): 30.25%
High scoring probability (total >= 79.0 pts): 15.54%
Low scoring probability (total <= 26.3 pts): 33.25%

#22: Western Michigan (-12.03, 16.29%) at Michigan State (12.03, 83.71%)
Estimated score: 20.02 - 31.98, Total: 52.00
Quality: 83.82%, Team quality: 87.07%, Competitiveness: 77.68%
Blowout probability (margin >= 34.0 pts): 3.65%
Close game probability (margin <= 8.5 pts): 33.97%
High scoring probability (total >= 79.0 pts): 22.90%
Low scoring probability (total <= 26.3 pts): 24.06%

#23: Temple (-3.28, 39.45%) at Massachusetts (3.28, 60.55%)
Estimated score: 27.58 - 30.84, Total: 58.42
Quality: 83.76%, Team quality: 77.36%, Competitiveness: 98.20%
Blowout probability (margin >= 34.0 pts): 0.72%
Close game probability (margin <= 8.5 pts): 49.70%
High scoring probability (total >= 79.0 pts): 28.57%
Low scoring probability (total <= 26.3 pts): 18.93%

#24: Jacksonville State (-14.60, 11.66%) at UCF (14.60, 88.34%)
Estimated score: 27.67 - 42.34, Total: 70.01
Quality: 83.62%, Team quality: 92.31%, Competitiveness: 68.60%
Blowout probability (margin >= 34.0 pts): 5.66%
Close game probability (margin <= 8.5 pts): 27.96%
High scoring probability (total >= 79.0 pts): 40.21%
Low scoring probability (total <= 26.3 pts): 11.54%

#25: Ball State (-7.44, 27.17%) at Purdue (7.44, 72.83%)
Estimated score: 31.43 - 38.84, Total: 70.27
Quality: 83.21%, Team quality: 79.58%, Competitiveness: 90.97%
Blowout probability (margin >= 34.0 pts): 1.54%
Close game probability (margin <= 8.5 pts): 43.80%
High scoring probability (total >= 79.0 pts): 40.49%
Low scoring probability (total <= 26.3 pts): 11.40%

#26: Hawai'i (-12.51, 15.35%) at Arizona (12.51, 84.65%)
Estimated score: 15.59 - 28.07, Total: 43.66
Quality: 82.27%, Team quality: 85.56%, Competitiveness: 76.06%
Blowout probability (margin >= 34.0 pts): 3.97%
Close game probability (margin <= 8.5 pts): 32.85%
High scoring probability (total >= 79.0 pts): 16.57%
Low scoring probability (total <= 26.3 pts): 31.73%

#27: Central Michigan (-11.95, 16.46%) at San José State (11.95, 83.54%)
Estimated score: 22.55 - 34.40, Total: 56.95
Quality: 81.75%, Team quality: 83.72%, Competitiveness: 77.96%
Blowout probability (margin >= 34.0 pts): 3.60%
Close game probability (margin <= 8.5 pts): 34.16%
High scoring probability (total >= 79.0 pts): 27.22%
Low scoring probability (total <= 26.3 pts): 20.04%

#28: Syracuse (-17.47, 7.69%) vs. Tennessee (17.47, 92.31%)
Estimated score: 21.52 - 39.18, Total: 60.71
Quality: 81.13%, Team quality: 96.13%, Competitiveness: 57.78%
Blowout probability (margin >= 34.0 pts): 8.85%
Close game probability (margin <= 8.5 pts): 21.51%
High scoring probability (total >= 79.0 pts): 30.74%
Low scoring probability (total <= 26.3 pts): 17.28%

#29: Idaho (-14.51, 11.80%) at Washington State (14.51, 88.20%)
Estimated score: 23.37 - 37.74, Total: 61.12
Quality: 80.80%, Team quality: 87.47%, Competitiveness: 68.93%
Blowout probability (margin >= 34.0 pts): 5.58%
Close game probability (margin <= 8.5 pts): 28.17%
High scoring probability (total >= 79.0 pts): 31.13%
Low scoring probability (total <= 26.3 pts): 16.99%

#30: Northwestern (-16.85, 8.44%) at Tulane (16.85, 91.56%)
Estimated score: 15.93 - 32.81, Total: 48.75
Quality: 80.26%, Team quality: 92.74%, Competitiveness: 60.12%
Blowout probability (margin >= 34.0 pts): 8.07%
Close game probability (margin <= 8.5 pts): 22.84%
High scoring probability (total >= 79.0 pts): 20.28%
Low scoring probability (total <= 26.3 pts): 26.93%

#31: Stony Brook (-9.49, 21.91%) at San Diego State (9.49, 78.09%)
Estimated score: 21.17 - 30.80, Total: 51.98
Quality: 79.61%, Team quality: 76.77%, Competitiveness: 85.61%
Blowout probability (margin >= 34.0 pts): 2.29%
Close game probability (margin <= 8.5 pts): 39.68%
High scoring probability (total >= 79.0 pts): 22.88%
Low scoring probability (total <= 26.3 pts): 24.08%

#32: Southeast Missouri State (-11.80, 16.77%) at Arkansas State (11.80, 83.23%)
Estimated score: 22.89 - 34.41, Total: 57.30
Quality: 79.01%, Team quality: 79.28%, Competitiveness: 78.47%
Blowout probability (margin >= 34.0 pts): 3.50%
Close game probability (margin <= 8.5 pts): 34.52%
High scoring probability (total >= 79.0 pts): 27.53%
Low scoring probability (total <= 26.3 pts): 19.78%

#33: Austin Peay (-4.59, 35.38%) at Middle Tennessee (4.59, 64.62%)
Estimated score: 21.79 - 26.42, Total: 48.21
Quality: 78.96%, Team quality: 71.44%, Competitiveness: 96.49%
Blowout probability (margin >= 34.0 pts): 0.90%
Close game probability (margin <= 8.5 pts): 48.27%
High scoring probability (total >= 79.0 pts): 19.87%
Low scoring probability (total <= 26.3 pts): 27.42%

#34: UT Martin (-16.54, 8.83%) at Oklahoma State (16.54, 91.17%)
Estimated score: 23.08 - 39.73, Total: 62.81
Quality: 76.99%, Team quality: 86.28%, Competitiveness: 61.29%
Blowout probability (margin >= 34.0 pts): 7.70%
Close game probability (margin <= 8.5 pts): 23.52%
High scoring probability (total >= 79.0 pts): 32.80%
Low scoring probability (total <= 26.3 pts): 15.84%

#35: UTEP (-13.74, 13.09%) at Utah State (13.74, 86.91%)
Estimated score: 29.14 - 42.77, Total: 71.91
Quality: 76.35%, Team quality: 78.77%, Competitiveness: 71.72%
Blowout probability (margin >= 34.0 pts): 4.91%
Close game probability (margin <= 8.5 pts): 29.96%
High scoring probability (total >= 79.0 pts): 42.24%
Low scoring probability (total <= 26.3 pts): 10.55%

#36: Abilene Christian (11.31, 82.22%) at Tulsa (-11.31, 17.78%)
Estimated score: 43.89 - 32.46, Total: 76.35
Quality: 75.95%, Team quality: 73.97%, Competitiveness: 80.07%
Blowout probability (margin >= 34.0 pts): 3.21%
Close game probability (margin <= 8.5 pts): 35.64%
High scoring probability (total >= 79.0 pts): 47.06%
Low scoring probability (total <= 26.3 pts): 8.49%

#37: SE Louisiana (-14.32, 12.11%) at Louisiana Tech (14.32, 87.89%)
Estimated score: 10.77 - 25.08, Total: 35.86
Quality: 74.90%, Team quality: 77.68%, Competitiveness: 69.62%
Blowout probability (margin >= 34.0 pts): 5.41%
Close game probability (margin <= 8.5 pts): 28.61%
High scoring probability (total >= 79.0 pts): 11.79%
Low scoring probability (total <= 26.3 pts): 39.70%

#38: South Dakota (-19.89, 5.22%) at Iowa State (19.89, 94.78%)
Estimated score: 13.60 - 33.60, Total: 47.19
Quality: 74.89%, Team quality: 92.99%, Competitiveness: 48.58%
Blowout probability (margin >= 34.0 pts): 12.45%
Close game probability (margin <= 8.5 pts): 16.60%
High scoring probability (total >= 79.0 pts): 19.10%
Low scoring probability (total <= 26.3 pts): 28.36%

#39: Merrimack (0.96, 53.13%) at Kent State (-0.96, 46.87%)
Estimated score: 27.58 - 26.98, Total: 54.55
Quality: 73.64%, Team quality: 63.25%, Competitiveness: 99.84%
Blowout probability (margin >= 34.0 pts): 0.56%
Close game probability (margin <= 8.5 pts): 51.10%
High scoring probability (total >= 79.0 pts): 25.07%
Low scoring probability (total <= 26.3 pts): 21.94%

#40: Colorado State (-20.73, 4.53%) at Washington (20.73, 95.47%)
Estimated score: 11.37 - 32.16, Total: 43.53
Quality: 71.40%, Team quality: 89.50%, Competitiveness: 45.45%
Blowout probability (margin >= 34.0 pts): 13.92%
Close game probability (margin <= 8.5 pts): 15.06%
High scoring probability (total >= 79.0 pts): 16.48%
Low scoring probability (total <= 26.3 pts): 31.86%

#41: Florida Atlantic (-19.82, 5.27%) at Maryland (19.82, 94.73%)
Estimated score: 19.41 - 39.27, Total: 58.67
Quality: 71.07%, Team quality: 85.77%, Competitiveness: 48.81%
Blowout probability (margin >= 34.0 pts): 12.35%
Close game probability (margin <= 8.5 pts): 16.72%
High scoring probability (total >= 79.0 pts): 28.80%
Low scoring probability (total <= 26.3 pts): 18.75%

#42: Stephen F. Austin (-19.69, 5.39%) at Houston (19.69, 94.61%)
Estimated score: 7.40 - 27.11, Total: 34.51
Quality: 70.88%, Team quality: 84.98%, Competitiveness: 49.31%
Blowout probability (margin >= 34.0 pts): 12.13%
Close game probability (margin <= 8.5 pts): 16.98%
High scoring probability (total >= 79.0 pts): 11.08%
Low scoring probability (total <= 26.3 pts): 41.14%

#43: Marshall (-22.55, 3.28%) at Georgia (22.55, 96.72%)
Estimated score: 15.57 - 38.06, Total: 53.63
Quality: 70.71%, Team quality: 95.38%, Competitiveness: 38.86%
Blowout probability (margin >= 34.0 pts): 17.50%
Close game probability (margin <= 8.5 pts): 12.00%
High scoring probability (total >= 79.0 pts): 24.27%
Low scoring probability (total <= 26.3 pts): 22.70%

#44: Eastern Michigan (-20.50, 4.71%) at Texas State (20.50, 95.29%)
Estimated score: 20.05 - 40.67, Total: 60.71
Quality: 70.48%, Team quality: 86.97%, Competitiveness: 46.29%
Blowout probability (margin >= 34.0 pts): 13.51%
Close game probability (margin <= 8.5 pts): 15.47%
High scoring probability (total >= 79.0 pts): 30.74%
Low scoring probability (total <= 26.3 pts): 17.27%

#45: Montana State (-23.16, 2.93%) at Oregon (23.16, 97.07%)
Estimated score: 17.49 - 40.69, Total: 58.18
Quality: 69.12%, Team quality: 94.80%, Competitiveness: 36.75%
Blowout probability (margin >= 34.0 pts): 18.81%
Close game probability (margin <= 8.5 pts): 11.07%
High scoring probability (total >= 79.0 pts): 28.34%
Low scoring probability (total <= 26.3 pts): 19.11%

#46: Nicholls (-18.88, 6.15%) at Troy (18.88, 93.85%)
Estimated score: 12.60 - 31.43, Total: 44.03
Quality: 68.40%, Team quality: 78.18%, Competitiveness: 52.36%
Blowout probability (margin >= 34.0 pts): 10.85%
Close game probability (margin <= 8.5 pts): 18.55%
High scoring probability (total >= 79.0 pts): 16.82%
Low scoring probability (total <= 26.3 pts): 31.37%

#47: Maine (-19.41, 5.65%) at Liberty (19.41, 94.35%)
Estimated score: 16.63 - 35.97, Total: 52.60
Quality: 66.41%, Team quality: 76.25%, Competitiveness: 50.37%
Blowout probability (margin >= 34.0 pts): 11.67%
Close game probability (margin <= 8.5 pts): 17.52%
High scoring probability (total >= 79.0 pts): 23.39%
Low scoring probability (total <= 26.3 pts): 23.56%

#48: Tarleton State (-23.66, 2.67%) at Army (23.66, 97.33%)
Estimated score: 11.35 - 35.05, Total: 46.40
Quality: 64.69%, Team quality: 87.84%, Competitiveness: 35.08%
Blowout probability (margin >= 34.0 pts): 19.92%
Close game probability (margin <= 8.5 pts): 10.36%
High scoring probability (total >= 79.0 pts): 18.51%
Low scoring probability (total <= 26.3 pts): 29.10%

#49: North Alabama (-21.17, 4.20%) at Western Kentucky (21.17, 95.80%)
Estimated score: 14.20 - 35.45, Total: 49.65
Quality: 64.64%, Team quality: 78.49%, Competitiveness: 43.83%
Blowout probability (margin >= 34.0 pts): 14.73%
Close game probability (margin <= 8.5 pts): 14.28%
High scoring probability (total >= 79.0 pts): 20.99%
Low scoring probability (total <= 26.3 pts): 26.12%

#50: UTSA (-25.28, 1.95%) at Texas A&M (25.28, 98.05%)
Estimated score: 17.98 - 43.16, Total: 61.14
Quality: 63.14%, Team quality: 91.84%, Competitiveness: 29.84%
Blowout probability (margin >= 34.0 pts): 23.82%
Close game probability (margin <= 8.5 pts): 8.24%
High scoring probability (total >= 79.0 pts): 31.16%
Low scoring probability (total <= 26.3 pts): 16.97%

#51: Kennesaw State (-22.57, 3.27%) at Wake Forest (22.57, 96.73%)
Estimated score: 14.11 - 36.57, Total: 50.68
Quality: 62.33%, Team quality: 78.99%, Competitiveness: 38.81%
Blowout probability (margin >= 34.0 pts): 17.53%
Close game probability (margin <= 8.5 pts): 11.97%
High scoring probability (total >= 79.0 pts): 21.81%
Low scoring probability (total <= 26.3 pts): 25.21%

#52: Chattanooga (-24.31, 2.36%) at Memphis (24.31, 97.64%)
Estimated score: 14.62 - 38.83, Total: 53.44
Quality: 62.02%, Team quality: 85.10%, Competitiveness: 32.93%
Blowout probability (margin >= 34.0 pts): 21.43%
Close game probability (margin <= 8.5 pts): 9.47%
High scoring probability (total >= 79.0 pts): 24.11%
Low scoring probability (total <= 26.3 pts): 22.85%

#53: Holy Cross (-23.95, 2.52%) at Northern Illinois (23.95, 97.48%)
Estimated score: 6.63 - 30.70, Total: 37.33
Quality: 60.65%, Team quality: 80.90%, Competitiveness: 34.09%
Blowout probability (margin >= 34.0 pts): 20.60%
Close game probability (margin <= 8.5 pts): 9.95%
High scoring probability (total >= 79.0 pts): 12.61%
Low scoring probability (total <= 26.3 pts): 38.15%

#54: Bryant (-18.80, 6.24%) at New Mexico State (18.80, 93.76%)
Estimated score: 20.66 - 39.42, Total: 60.08
Quality: 58.97%, Team quality: 62.40%, Competitiveness: 52.68%
Blowout probability (margin >= 34.0 pts): 10.73%
Close game probability (margin <= 8.5 pts): 18.72%
High scoring probability (total >= 79.0 pts): 30.14%
Low scoring probability (total <= 26.3 pts): 17.72%

#55: Lamar (-24.61, 2.22%) at North Texas (24.61, 97.78%)
Estimated score: 16.93 - 41.56, Total: 58.49
Quality: 57.73%, Team quality: 77.60%, Competitiveness: 31.95%
Blowout probability (margin >= 34.0 pts): 22.17%
Close game probability (margin <= 8.5 pts): 9.07%
High scoring probability (total >= 79.0 pts): 28.63%
Low scoring probability (total <= 26.3 pts): 18.88%

#56: Alabama State (-22.98, 3.03%) at UAB (22.98, 96.97%)
Estimated score: 11.52 - 34.62, Total: 46.13
Quality: 57.44%, Team quality: 71.19%, Competitiveness: 37.39%
Blowout probability (margin >= 34.0 pts): 18.40%
Close game probability (margin <= 8.5 pts): 11.35%
High scoring probability (total >= 79.0 pts): 18.32%
Low scoring probability (total <= 26.3 pts): 29.35%

#57: Mississippi State (25.68, 98.20%) at Southern Miss (-25.68, 1.80%)
Estimated score: 42.74 - 17.01, Total: 59.75
Quality: 57.38%, Team quality: 81.24%, Competitiveness: 28.63%
Blowout probability (margin >= 34.0 pts): 24.84%
Close game probability (margin <= 8.5 pts): 7.77%
High scoring probability (total >= 79.0 pts): 29.82%
Low scoring probability (total <= 26.3 pts): 17.96%

#58: Buffalo (-27.92, 1.13%) at Minnesota (27.92, 98.87%)
Estimated score: 9.38 - 37.25, Total: 46.63
Quality: 56.76%, Team quality: 90.56%, Competitiveness: 22.30%
Blowout probability (margin >= 34.0 pts): 30.97%
Close game probability (margin <= 8.5 pts): 5.49%
High scoring probability (total >= 79.0 pts): 18.68%
Low scoring probability (total <= 26.3 pts): 28.89%

#59: Alabama (28.57, 99.02%) at Florida State (-28.57, 0.98%)
Estimated score: 35.68 - 7.25, Total: 42.92
Quality: 56.44%, Team quality: 93.36%, Competitiveness: 20.62%
Blowout probability (margin >= 34.0 pts): 32.89%
Close game probability (margin <= 8.5 pts): 4.93%
High scoring probability (total >= 79.0 pts): 16.07%
Low scoring probability (total <= 26.3 pts): 32.46%

#60: New Mexico (-29.04, 0.89%) at Michigan (29.04, 99.11%)
Estimated score: 16.84 - 45.78, Total: 62.61
Quality: 53.75%, Team quality: 89.26%, Competitiveness: 19.50%
Blowout probability (margin >= 34.0 pts): 34.26%
Close game probability (margin <= 8.5 pts): 4.57%
High scoring probability (total >= 79.0 pts): 32.60%
Low scoring probability (total <= 26.3 pts): 15.97%

#61: Old Dominion (-30.28, 0.67%) at Indiana (30.28, 99.33%)
Estimated score: 14.66 - 45.03, Total: 59.70
Quality: 52.88%, Team quality: 94.21%, Competitiveness: 16.66%
Blowout probability (margin >= 34.0 pts): 38.06%
Close game probability (margin <= 8.5 pts): 3.69%
High scoring probability (total >= 79.0 pts): 29.77%
Low scoring probability (total <= 26.3 pts): 18.00%

#62: Bucknell (-25.97, 1.70%) at Air Force (25.97, 98.30%)
Estimated score: 12.06 - 37.92, Total: 49.98
Quality: 52.15%, Team quality: 71.49%, Competitiveness: 27.75%
Blowout probability (margin >= 34.0 pts): 25.60%
Close game probability (margin <= 8.5 pts): 7.44%
High scoring probability (total >= 79.0 pts): 21.25%
Low scoring probability (total <= 26.3 pts): 25.82%

#63: Weber State (-29.32, 0.83%) at James Madison (29.32, 99.17%)
Estimated score: 12.68 - 41.82, Total: 54.50
Quality: 50.17%, Team quality: 81.92%, Competitiveness: 18.81%
Blowout probability (margin >= 34.0 pts): 35.12%
Close game probability (margin <= 8.5 pts): 4.35%
High scoring probability (total >= 79.0 pts): 25.03%
Low scoring probability (total <= 26.3 pts): 21.98%

#64: Elon (-31.12, 0.55%) at Duke (31.12, 99.45%)
Estimated score: 8.49 - 39.45, Total: 47.94
Quality: 46.29%, Team quality: 81.56%, Competitiveness: 14.91%
Blowout probability (margin >= 34.0 pts): 40.69%
Close game probability (margin <= 8.5 pts): 3.18%
High scoring probability (total >= 79.0 pts): 19.66%
Low scoring probability (total <= 26.3 pts): 27.67%

#65: Lafayette (-32.69, 0.38%) at Bowling Green (32.69, 99.62%)
Estimated score: 6.91 - 39.59, Total: 46.50
Quality: 40.52%, Team quality: 74.55%, Competitiveness: 11.97%
Blowout probability (margin >= 34.0 pts): 45.76%
Close game probability (margin <= 8.5 pts): 2.37%
High scoring probability (total >= 79.0 pts): 18.58%
Low scoring probability (total <= 26.3 pts): 29.01%

#66: Missouri State (-35.00, 0.21%) at USC (35.00, 99.79%)
Estimated score: 15.14 - 50.13, Total: 65.27
Quality: 40.39%, Team quality: 88.16%, Competitiveness: 8.48%
Blowout probability (margin >= 34.0 pts): 53.26%
Close game probability (margin <= 8.5 pts): 1.50%
High scoring probability (total >= 79.0 pts): 35.27%
Low scoring probability (total <= 26.3 pts): 14.27%

#67: Illinois State (-34.75, 0.23%) at Oklahoma (34.75, 99.77%)
Estimated score: 3.57 - 38.17, Total: 41.75
Quality: 40.16%, Team quality: 85.70%, Competitiveness: 8.82%
Blowout probability (margin >= 34.0 pts): 52.43%
Close game probability (margin <= 8.5 pts): 1.58%
High scoring probability (total >= 79.0 pts): 15.30%
Low scoring probability (total <= 26.3 pts): 33.63%

#68: North Dakota (-34.91, 0.22%) at Kansas State (34.91, 99.78%)
Estimated score: 12.55 - 47.59, Total: 60.14
Quality: 40.09%, Team quality: 86.60%, Competitiveness: 8.59%
Blowout probability (margin >= 34.0 pts): 52.98%
Close game probability (margin <= 8.5 pts): 1.53%
High scoring probability (total >= 79.0 pts): 30.19%
Low scoring probability (total <= 26.3 pts): 17.68%

#69: Central Connecticut (-33.62, 0.30%) at UConn (33.62, 99.70%)
Estimated score: 7.57 - 41.27, Total: 48.83
Quality: 39.36%, Team quality: 76.34%, Competitiveness: 10.46%
Blowout probability (margin >= 34.0 pts): 48.76%
Close game probability (margin <= 8.5 pts): 1.98%
High scoring probability (total >= 79.0 pts): 20.35%
Low scoring probability (total <= 26.3 pts): 26.85%

#70: Nevada (-36.40, 0.15%) at Penn State (36.40, 99.85%)
Estimated score: 5.76 - 42.27, Total: 48.03
Quality: 38.39%, Team quality: 91.40%, Competitiveness: 6.77%
Blowout probability (margin >= 34.0 pts): 57.77%
Close game probability (margin <= 8.5 pts): 1.12%
High scoring probability (total >= 79.0 pts): 19.73%
Low scoring probability (total <= 26.3 pts): 27.58%

#71: Northern Arizona (-37.26, 0.12%) at Arizona State (37.26, 99.88%)
Estimated score: 2.11 - 39.56, Total: 41.68
Quality: 35.66%, Team quality: 87.92%, Competitiveness: 5.87%
Blowout probability (margin >= 34.0 pts): 60.51%
Close game probability (margin <= 8.5 pts): 0.93%
High scoring probability (total >= 79.0 pts): 15.25%
Low scoring probability (total <= 26.3 pts): 33.69%

#72: St. Francis (PA) (-33.94, 0.28%) at UL Monroe (33.94, 99.72%)
Estimated score: 0.00 - 33.61, Total: 33.61
Quality: 35.34%, Team quality: 66.52%, Competitiveness: 9.98%
Blowout probability (margin >= 34.0 pts): 49.80%
Close game probability (margin <= 8.5 pts): 1.86%
High scoring probability (total >= 79.0 pts): 10.62%
Low scoring probability (total <= 26.3 pts): 42.09%

#73: Central Arkansas (-37.13, 0.12%) at Missouri (37.13, 99.88%)
Estimated score: 8.26 - 45.24, Total: 53.50
Quality: 35.04%, Team quality: 84.70%, Competitiveness: 6.00%
Blowout probability (margin >= 34.0 pts): 60.09%
Close game probability (margin <= 8.5 pts): 0.96%
High scoring probability (total >= 79.0 pts): 24.16%
Low scoring probability (total <= 26.3 pts): 22.80%

#74: Duquesne (-37.86, 0.10%) at Pittsburgh (37.86, 99.90%)
Estimated score: 10.68 - 48.50, Total: 59.18
Quality: 32.03%, Team quality: 78.76%, Competitiveness: 5.30%
Blowout probability (margin >= 34.0 pts): 62.37%
Close game probability (margin <= 8.5 pts): 0.82%
High scoring probability (total >= 79.0 pts): 29.28%
Low scoring probability (total <= 26.3 pts): 18.37%

#75: Morgan State (-37.38, 0.11%) at South Alabama (37.38, 99.89%)
Estimated score: 6.93 - 44.16, Total: 51.09
Quality: 31.56%, Team quality: 73.92%, Competitiveness: 5.75%
Blowout probability (margin >= 34.0 pts): 60.88%
Close game probability (margin <= 8.5 pts): 0.91%
High scoring probability (total >= 79.0 pts): 22.15%
Low scoring probability (total <= 26.3 pts): 24.85%

#76: Robert Morris (-39.76, 0.06%) at West Virginia (39.76, 99.94%)
Estimated score: 4.66 - 44.52, Total: 49.18
Quality: 27.76%, Team quality: 75.27%, Competitiveness: 3.78%
Blowout probability (margin >= 34.0 pts): 68.10%
Close game probability (margin <= 8.5 pts): 0.53%
High scoring probability (total >= 79.0 pts): 20.62%
Low scoring probability (total <= 26.3 pts): 26.54%

#77: Delaware State (-36.85, 0.13%) at Delaware (36.85, 99.87%)
Estimated score: 14.52 - 51.33, Total: 65.84
Quality: 27.39%, Team quality: 57.16%, Competitiveness: 6.29%
Blowout probability (margin >= 34.0 pts): 59.20%
Close game probability (margin <= 8.5 pts): 1.02%
High scoring probability (total >= 79.0 pts): 35.86%
Low scoring probability (total <= 26.3 pts): 13.91%

#78: Georgia State (-42.80, 0.02%) at Ole Miss (42.80, 99.98%)
Estimated score: 6.73 - 49.65, Total: 56.38
Quality: 25.80%, Team quality: 90.41%, Competitiveness: 2.10%
Blowout probability (margin >= 34.0 pts): 76.39%
Close game probability (margin <= 8.5 pts): 0.25%
High scoring probability (total >= 79.0 pts): 26.69%
Low scoring probability (total <= 26.3 pts): 20.49%

#79: Bethune-Cookman (-39.53, 0.06%) at Florida International (39.53, 99.94%)
Estimated score: 5.36 - 44.88, Total: 50.24
Quality: 24.67%, Team quality: 61.73%, Competitiveness: 3.94%
Blowout probability (margin >= 34.0 pts): 67.42%
Close game probability (margin <= 8.5 pts): 0.56%
High scoring probability (total >= 79.0 pts): 21.46%
Low scoring probability (total <= 26.3 pts): 25.59%

#80: Portland State (-45.21, 0.01%) at BYU (45.21, 99.99%)
Estimated score: 6.24 - 51.38, Total: 57.63
Quality: 20.62%, Team quality: 83.01%, Competitiveness: 1.27%
Blowout probability (margin >= 34.0 pts): 81.99%
Close game probability (margin <= 8.5 pts): 0.14%
High scoring probability (total >= 79.0 pts): 27.83%
Low scoring probability (total <= 26.3 pts): 19.53%

#81: Eastern Kentucky (-45.58, 0.01%) at Louisville (45.58, 99.99%)
Estimated score: 3.47 - 49.23, Total: 52.70
Quality: 20.19%, Team quality: 83.72%, Competitiveness: 1.18%
Blowout probability (margin >= 34.0 pts): 82.77%
Close game probability (margin <= 8.5 pts): 0.12%
High scoring probability (total >= 79.0 pts): 23.48%
Low scoring probability (total <= 26.3 pts): 23.47%

#82: Western Illinois (-46.75, 0.01%) at Illinois (46.75, 99.99%)
Estimated score: 15.15 - 61.91, Total: 77.06
Quality: 17.46%, Team quality: 76.67%, Competitiveness: 0.91%
Blowout probability (margin >= 34.0 pts): 85.11%
Close game probability (margin <= 8.5 pts): 0.09%
High scoring probability (total >= 79.0 pts): 47.83%
Low scoring probability (total <= 26.3 pts): 8.19%

#83: UAlbany (-49.87, 0.00%) at Iowa (49.87, 100.00%)
Estimated score: 0.00 - 47.03, Total: 47.03
Quality: 13.88%, Team quality: 78.30%, Competitiveness: 0.44%
Blowout probability (margin >= 34.0 pts): 90.24%
Close game probability (margin <= 8.5 pts): 0.04%
High scoring probability (total >= 79.0 pts): 18.98%
Low scoring probability (total <= 26.3 pts): 28.51%

#84: Fordham (-49.36, 0.00%) at Boston College (49.36, 100.00%)
Estimated score: 0.00 - 47.80, Total: 47.80
Quality: 13.68%, Team quality: 72.07%, Competitiveness: 0.49%
Blowout probability (margin >= 34.0 pts): 89.51%
Close game probability (margin <= 8.5 pts): 0.04%
High scoring probability (total >= 79.0 pts): 19.56%
Low scoring probability (total <= 26.3 pts): 27.79%

#85: Charleston Southern (-50.42, 0.00%) at Vanderbilt (50.42, 100.00%)
Estimated score: 0.00 - 45.43, Total: 45.43
Quality: 12.83%, Team quality: 74.57%, Competitiveness: 0.38%
Blowout probability (margin >= 34.0 pts): 91.00%
Close game probability (margin <= 8.5 pts): 0.03%
High scoring probability (total >= 79.0 pts): 17.81%
Low scoring probability (total <= 26.3 pts): 30.02%

#86: Alabama A&M (-52.60, 0.00%) at Arkansas (52.60, 100.00%)
Estimated score: 7.03 - 59.77, Total: 66.79
Quality: 10.49%, Team quality: 72.70%, Competitiveness: 0.22%
Blowout probability (margin >= 34.0 pts): 93.56%
Close game probability (margin <= 8.5 pts): 0.02%
High scoring probability (total >= 79.0 pts): 36.84%
Low scoring probability (total <= 26.3 pts): 13.34%

#87: VMI (-52.15, 0.00%) at Navy (52.15, 100.00%)
Estimated score: 0.00 - 49.28, Total: 49.28
Quality: 10.41%, Team quality: 67.82%, Competitiveness: 0.25%
Blowout probability (margin >= 34.0 pts): 93.08%
Close game probability (margin <= 8.5 pts): 0.02%
High scoring probability (total >= 79.0 pts): 20.70%
Low scoring probability (total <= 26.3 pts): 26.45%

#88: Long Island University (-53.58, 0.00%) at Florida (53.58, 100.00%)
Estimated score: 0.00 - 53.68, Total: 53.68
Quality: 9.98%, Team quality: 76.82%, Competitiveness: 0.17%
Blowout probability (margin >= 34.0 pts): 94.51%
Close game probability (margin <= 8.5 pts): 0.01%
High scoring probability (total >= 79.0 pts): 24.31%
Low scoring probability (total <= 26.3 pts): 22.66%

#89: Wagner (-58.85, 0.00%) at Kansas (58.85, 100.00%)
Estimated score: 0.00 - 52.30, Total: 52.30
Quality: 5.72%, Team quality: 70.22%, Competitiveness: 0.04%
Blowout probability (margin >= 34.0 pts): 97.88%
Close game probability (margin <= 8.5 pts): 0.00%
High scoring probability (total >= 79.0 pts): 23.14%
Low scoring probability (total <= 26.3 pts): 23.81%

#90: East Texas A&M (-59.86, 0.00%) at SMU (59.86, 100.00%)
Estimated score: 0.00 - 59.01, Total: 59.01
Quality: 5.30%, Team quality: 73.13%, Competitiveness: 0.03%
Blowout probability (margin >= 34.0 pts): 98.27%
Close game probability (margin <= 8.5 pts): 0.00%
High scoring probability (total >= 79.0 pts): 29.12%
Low scoring probability (total <= 26.3 pts): 18.49%

#91: Arkansas-Pine Bluff (-65.30, 0.00%) at Texas Tech (65.30, 100.00%)
Estimated score: 3.55 - 68.69, Total: 72.24
Quality: 2.55%, Team quality: 58.80%, Competitiveness: 0.00%
Blowout probability (margin >= 34.0 pts): 99.47%
Close game probability (margin <= 8.5 pts): 0.00%
High scoring probability (total >= 79.0 pts): 42.60%
Low scoring probability (total <= 26.3 pts): 10.39%
This system is still a work in progress, and I intend to verify its accuracy later in the season when the ratings aren’t based heavily on last year’s games. I’ll post my code for both college football and NFL data on Github once I get it cleaned up and properly commented.
As a reminder, there's quite a bit of time and effort needed to develop and test this software. Sometimes there are subtle issues that require many rounds of testing to diagnose and resolve. I don't use AI assistance to write my article, either. If you'd like to support continued open development of software like this, please consider subscribing, sharing my articles on social media, forwarding my emails to people who might be interested, and making a financial contribution.
These ratings and predictions are based on data from collegefootballdata.com.