


NFL Computer Ratings and Predictions for Week 17
Game predictions starting with the two NFL games on Christmas day

Merry Christmas! Week 17 in the NFL starts a bit early because there are two Christmas games that are only televised on Netflix. That means it's time to schedule updated ratings and week 17 predictions a bit ahead of the kickoff. This is a quick article with just the stats and predictions, but I'll have some more content later in the week.
As a reminder, the best predictor of a team's performance should be the advanced (Adv.) ratings, which accounts for margin of victory and the quality of a team's opponents. The MOV+ and MOV take into account margin of victory but do not factor in the strength of a team's schedule, so they should be a bit less accurate. Finally, the Win% ratings only take into account a team's whether a team won or lost their games, so this should be the least accurate predictor of a team's future performance. The advanced rating for NFL teams is mostly the same as my predictive rating for college football teams. I could calculate a strength of record rating and combine them together like I do with my college football ratings, but schedule strengths are similar enough in the NFL that it's better to just look at the standings.
Team Ratings
Here are the ratings:
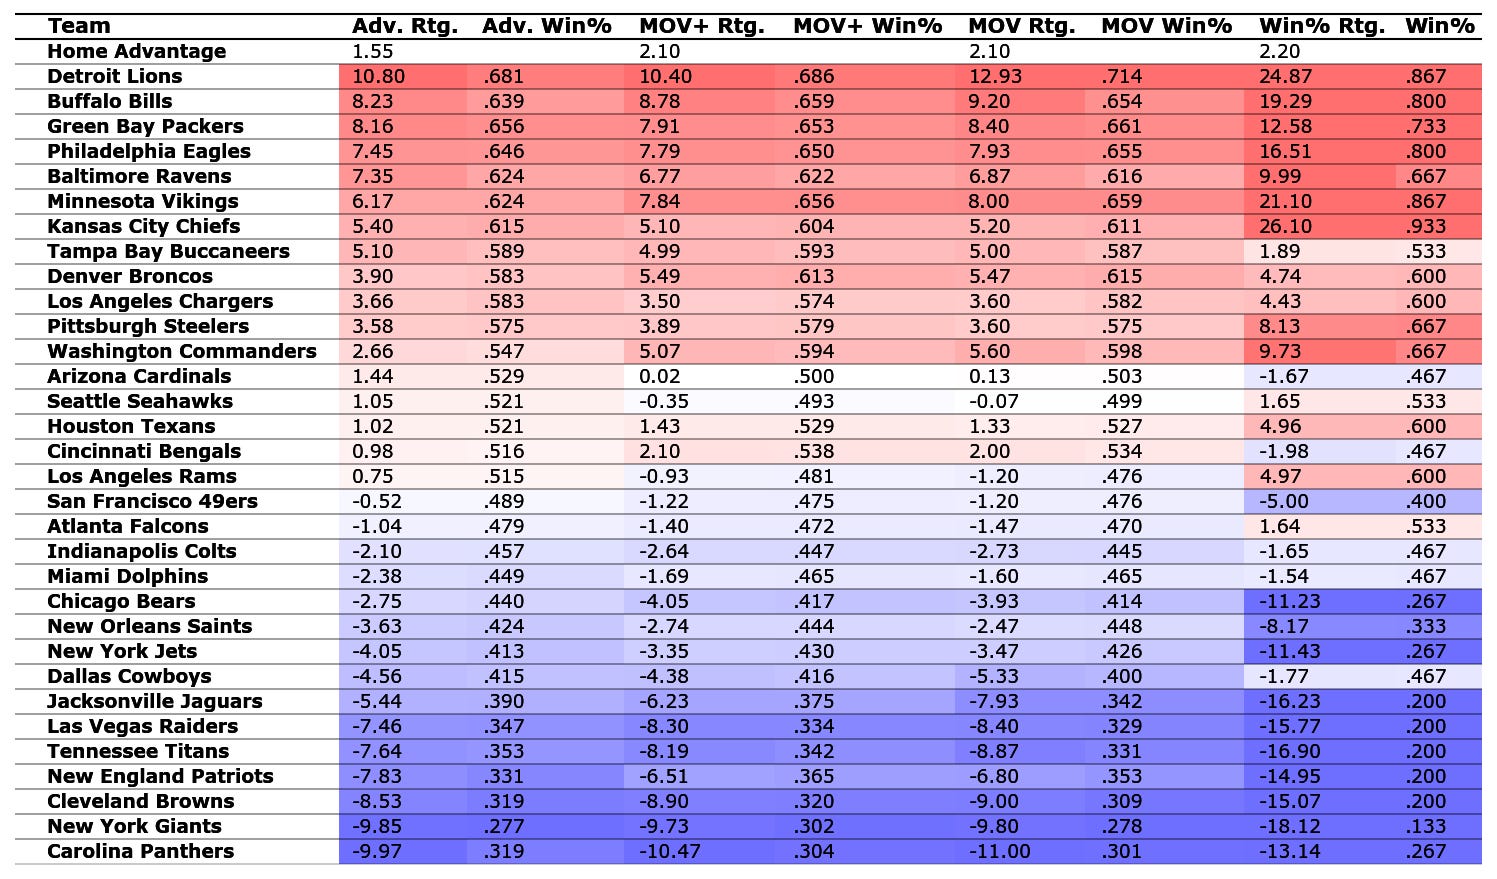
To calculate a the expected margin of victory for the home team, take the home team's rating, add the home advantage, and subtract the visiting team's rating. For a game played at a neutral site, just repeat the process but skip the step of adding the home advantage.
Schedule Strength
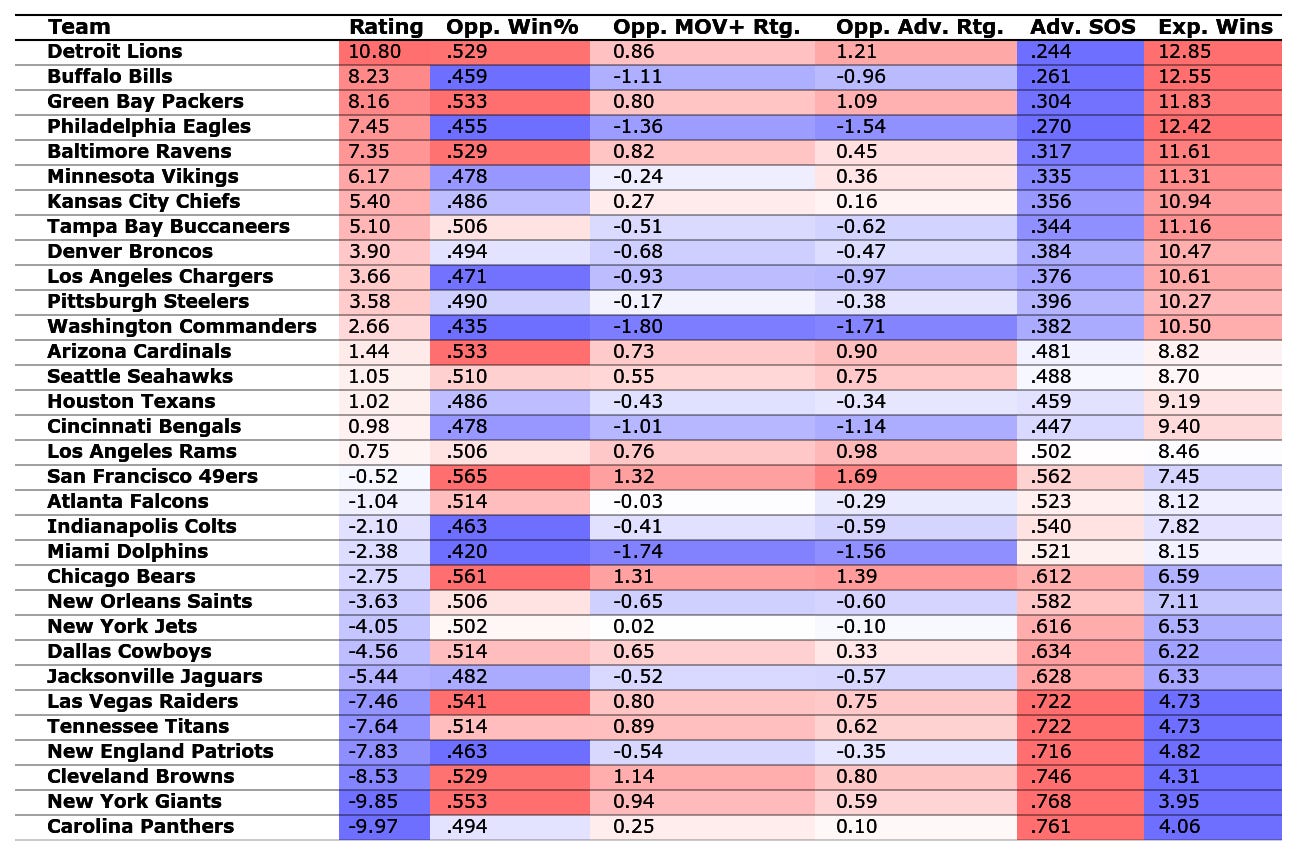
Unlike in college football, I'm calculating schedule strength for the entire schedule instead of just games that have already been played. The first column, "Rating" is a team's rating according to the advanced rating system. The second column, "Opp. Win%" is the average winning percentage of each team's opponents. The next column, "Opp. MOV+ Rtg." is the average of the team's opponents' ratings according to the MOV+ system, which is probably a bit less accurate than the advanced system. The "Opp. Adv. Rtg." is like the previous column, but averages the ratings of each team's opponents according to the advanced system, and should be more accurate. The differences are mostly small between the columns, but they are present.
The "Adv. SOS" column is the expected percentage of games that a team is expected to lose based on their advanced rating and the advanced rating of their opponents. This attempts to answer the question of how difficult a team's schedule is for that team. The "Exp. Wins" uses the "Adv. SOS" column to estimate the number of games each team would be expected to win over the course of the season. As an example, the average opponent advanced rating of 1.21 for the Detroit Lions is a relatively difficult schedule for an average NFL team, but because the Lions are at the top of the rankings, they would only be expected to lose 24.4% of their games against a schedule of this difficulty.
Game Predictions
As always, the advanced ratings should be the most accurate predictor of future performance, but the other options are mainly here for comparison and later verification of the predictions.
Kansas City Chiefs (KC) at Pittsburgh Steelers (PIT)
Winning percentage (Win%) forecast: KC (16.32, 81.77%) | PIT (-16.32, 17.90%) | Tie (0.32%)
Unadjusted margin of victory (MOV) forecast: KC (0.14, 50.16%) | PIT (-0.14, 49.44%) | Tie (0.40%)
Adjusted margin of victory (MOV+) forecast: KC (-0.25, 49.17%) | PIT (0.25, 50.44%) | Tie (0.39%)
Advanced (Adv.) forecast: KC (0.27, 50.67%) | PIT (-0.27, 48.82%) | Tie (0.52%)
Probability of competitive game: 53.53% | Competitive quality: 99.97% | Quality of teams: 78.33% | Game quality: 84.97%
Baltimore Ravens (BAL) at Houston Texans (HOU)
Winning percentage (Win%) forecast: BAL (3.39, 58.15%) | HOU (-3.39, 41.17%) | Tie (0.68%)
Unadjusted margin of victory (MOV) forecast: BAL (4.07, 59.96%) | HOU (-4.07, 39.67%) | Tie (0.38%)
Adjusted margin of victory (MOV+) forecast: BAL (3.88, 59.50%) | HOU (-3.88, 40.14%) | Tie (0.37%)
Advanced (Adv.) forecast: BAL (4.77, 65.44%) | HOU (-4.77, 34.12%) | Tie (0.44%)
Probability of competitive game: 49.25% | Competitive quality: 91.98% | Quality of teams: 73.80% | Game quality: 79.42%
Seattle Seahawks (SEA) at Chicago Bears (CHI)
Winning percentage (Win%) forecast: SEA (11.23, 74.58%) | CHI (-11.23, 24.96%) | Tie (0.46%)
Unadjusted margin of victory (MOV) forecast: SEA (2.41, 55.88%) | CHI (-2.41, 43.73%) | Tie (0.39%)
Adjusted margin of victory (MOV+) forecast: SEA (2.23, 55.45%) | CHI (-2.23, 44.17%) | Tie (0.38%)
Advanced (Adv.) forecast: SEA (2.25, 57.44%) | CHI (-2.25, 42.06%) | Tie (0.50%)
Probability of competitive game: 52.56% | Competitive quality: 98.16% | Quality of teams: 43.56% | Game quality: 57.11%
Los Angeles Chargers (LAC) at New England Patriots (NE)
Winning percentage (Win%) forecast: LAC (17.73, 83.34%) | NE (-17.73, 16.37%) | Tie (0.29%)
Unadjusted margin of victory (MOV) forecast: LAC (8.94, 70.55%) | NE (-8.94, 29.15%) | Tie (0.30%)
Adjusted margin of victory (MOV+) forecast: LAC (8.55, 69.79%) | NE (-8.55, 29.91%) | Tie (0.30%)
Advanced (Adv.) forecast: LAC (9.94, 78.17%) | NE (-9.94, 21.54%) | Tie (0.29%)
Probability of competitive game: 37.22% | Competitive quality: 69.51% | Quality of teams: 27.50% | Game quality: 37.46%
Denver Broncos (DEN) at Cincinnati Bengals (CIN)
Winning percentage (Win%) forecast: DEN (5.07, 62.17%) | CIN (-5.07, 37.19%) | Tie (0.64%)
Unadjusted margin of victory (MOV) forecast: DEN (2.01, 54.88%) | CIN (-2.01, 44.72%) | Tie (0.40%)
Adjusted margin of victory (MOV+) forecast: DEN (1.93, 54.71%) | CIN (-1.93, 44.91%) | Tie (0.38%)
Advanced (Adv.) forecast: DEN (1.38, 54.49%) | CIN (-1.38, 45.00%) | Tie (0.51%)
Probability of competitive game: 53.18% | Competitive quality: 99.31% | Quality of teams: 66.23% | Game quality: 75.81%
Arizona Cardinals (ARI) at Los Angeles Rams (LAR)
Winning percentage (Win%) forecast: ARI (-8.29, 30.29%) | LAR (8.29, 69.15%) | Tie (0.55%)
Unadjusted margin of victory (MOV) forecast: ARI (-0.13, 49.48%) | LAR (0.13, 50.12%) | Tie (0.40%)
Adjusted margin of victory (MOV+) forecast: ARI (-0.51, 48.50%) | LAR (0.51, 51.11%) | Tie (0.39%)
Advanced (Adv.) forecast: ARI (-0.86, 46.77%) | LAR (0.86, 52.72%) | Tie (0.51%)
Probability of competitive game: 53.40% | Competitive quality: 99.73% | Quality of teams: 57.50% | Game quality: 69.09%
New York Jets (NYJ) at Buffalo Bills (BUF)
Winning percentage (Win%) forecast: NYJ (-27.75, 9.13%) | BUF (27.75, 90.73%) | Tie (0.14%)
Unadjusted margin of victory (MOV) forecast: NYJ (-14.13, 20.71%) | BUF (14.13, 79.07%) | Tie (0.22%)
Adjusted margin of victory (MOV+) forecast: NYJ (-13.59, 21.45%) | BUF (13.59, 78.33%) | Tie (0.22%)
Advanced (Adv.) forecast: NYJ (-13.83, 15.37%) | BUF (13.83, 84.44%) | Tie (0.20%)
Probability of competitive game: 27.03% | Competitive quality: 50.48% | Quality of teams: 43.43% | Game quality: 45.66%
Tennessee Titans (TEN) at Jacksonville Jaguars (JAX)
Winning percentage (Win%) forecast: TEN (-2.33, 43.78%) | JAX (2.33, 55.53%) | Tie (0.69%)
Unadjusted margin of victory (MOV) forecast: TEN (-2.39, 43.76%) | JAX (2.39, 55.85%) | Tie (0.39%)
Adjusted margin of victory (MOV+) forecast: TEN (-3.42, 41.24%) | JAX (3.42, 58.39%) | Tie (0.37%)
Advanced (Adv.) forecast: TEN (-3.75, 37.22%) | JAX (3.75, 62.31%) | Tie (0.47%)
Probability of competitive game: 50.86% | Competitive quality: 94.98% | Quality of teams: 12.16% | Game quality: 24.12%
Las Vegas Raiders (LV) at New Orleans Saints (NO)
Winning percentage (Win%) forecast: LV (-9.25, 28.46%) | NO (9.25, 71.02%) | Tie (0.52%)
Unadjusted margin of victory (MOV) forecast: LV (-7.39, 32.23%) | NO (7.39, 67.44%) | Tie (0.33%)
Adjusted margin of victory (MOV+) forecast: LV (-7.02, 33.03%) | NO (7.02, 66.65%) | Tie (0.32%)
Advanced (Adv.) forecast: LV (-5.37, 32.39%) | NO (5.37, 67.19%) | Tie (0.43%)
Probability of competitive game: 48.16% | Competitive quality: 89.93% | Quality of teams: 15.27% | Game quality: 27.58%
Dallas Cowboys (DAL) at Philadelphia Eagles (PHI)
Winning percentage (Win%) forecast: DAL (-19.93, 14.28%) | PHI (19.93, 85.48%) | Tie (0.24%)
Unadjusted margin of victory (MOV) forecast: DAL (-14.73, 19.92%) | PHI (14.73, 79.88%) | Tie (0.21%)
Adjusted margin of victory (MOV+) forecast: DAL (-13.63, 21.41%) | PHI (13.63, 78.38%) | Tie (0.22%)
Advanced (Adv.) forecast: DAL (-13.56, 15.72%) | PHI (13.56, 84.08%) | Tie (0.20%)
Probability of competitive game: 27.69% | Competitive quality: 51.71% | Quality of teams: 40.33% | Game quality: 43.81%
Indianapolis Colts (IND) at New York Giants (NYG)
Winning percentage (Win%) forecast: IND (14.82, 79.93%) | NYG (-14.82, 19.72%) | Tie (0.36%)
Unadjusted margin of victory (MOV) forecast: IND (5.61, 63.54%) | NYG (-5.61, 36.11%) | Tie (0.36%)
Adjusted margin of victory (MOV+) forecast: IND (5.63, 63.60%) | NYG (-5.63, 36.05%) | Tie (0.34%)
Advanced (Adv.) forecast: IND (6.20, 69.47%) | NYG (-6.20, 30.13%) | Tie (0.40%)
Probability of competitive game: 46.49% | Competitive quality: 86.82% | Quality of teams: 13.23% | Game quality: 24.77%
Carolina Panthers (CAR) at Tampa Bay Buccaneers (TB)
Winning percentage (Win%) forecast: CAR (-16.68, 17.49%) | TB (16.68, 82.19%) | Tie (0.31%)
Unadjusted margin of victory (MOV) forecast: CAR (-17.46, 16.71%) | TB (17.46, 83.12%) | Tie (0.17%)
Adjusted margin of victory (MOV+) forecast: CAR (-16.92, 17.30%) | TB (16.92, 82.53%) | Tie (0.17%)
Advanced (Adv.) forecast: CAR (-16.62, 12.22%) | TB (16.62, 87.63%) | Tie (0.15%)
Probability of competitive game: 20.75% | Competitive quality: 38.74% | Quality of teams: 16.07% | Game quality: 21.55%
Miami Dolphins (MIA) at Cleveland Browns (CLE)
Winning percentage (Win%) forecast: MIA (11.88, 75.63%) | CLE (-11.88, 23.92%) | Tie (0.44%)
Unadjusted margin of victory (MOV) forecast: MIA (5.94, 64.29%) | CLE (-5.94, 35.36%) | Tie (0.35%)
Adjusted margin of victory (MOV+) forecast: MIA (5.75, 63.87%) | CLE (-5.75, 35.79%) | Tie (0.34%)
Advanced (Adv.) forecast: MIA (4.60, 64.93%) | CLE (-4.60, 34.62%) | Tie (0.45%)
Probability of competitive game: 49.54% | Competitive quality: 92.52% | Quality of teams: 16.01% | Game quality: 28.73%
Green Bay Packers (GB) at Minnesota Vikings (MIN)
Winning percentage (Win%) forecast: GB (-10.17, 26.77%) | MIN (10.17, 72.73%) | Tie (0.50%)
Unadjusted margin of victory (MOV) forecast: GB (-1.06, 47.11%) | MIN (1.06, 52.49%) | Tie (0.40%)
Adjusted margin of victory (MOV+) forecast: GB (-1.39, 46.29%) | MIN (1.39, 53.33%) | Tie (0.38%)
Advanced (Adv.) forecast: GB (0.44, 51.27%) | MIN (-0.44, 48.21%) | Tie (0.52%)
Probability of competitive game: 53.51% | Competitive quality: 99.93% | Quality of teams: 89.42% | Game quality: 92.80%
Atlanta Falcons (ATL) at Washington Commanders (WAS)
Winning percentage (Win%) forecast: ATL (-9.74, 27.55%) | WAS (9.74, 71.94%) | Tie (0.51%)
Unadjusted margin of victory (MOV) forecast: ATL (-8.53, 29.95%) | WAS (8.53, 69.74%) | Tie (0.31%)
Adjusted margin of victory (MOV+) forecast: ATL (-7.92, 31.15%) | WAS (7.92, 68.54%) | Tie (0.31%)
Advanced (Adv.) forecast: ATL (-5.25, 32.75%) | WAS (5.25, 66.82%) | Tie (0.43%)
Probability of competitive game: 48.40% | Competitive quality: 90.38% | Quality of teams: 52.21% | Game quality: 62.69%
Detroit Lions (DET) at San Francisco 49ers (SF)
Winning percentage (Win%) forecast: DET (26.36, 90.01%) | SF (-26.36, 9.84%) | Tie (0.15%)
Unadjusted margin of victory (MOV) forecast: DET (12.67, 76.97%) | SF (-12.67, 22.79%) | Tie (0.24%)
Adjusted margin of victory (MOV+) forecast: DET (10.16, 72.83%) | SF (-10.16, 26.90%) | Tie (0.27%)
Advanced (Adv.) forecast: DET (9.78, 77.84%) | SF (-9.78, 21.87%) | Tie (0.29%)
Probability of competitive game: 37.67% | Competitive quality: 70.35% | Quality of teams: 70.48% | Game quality: 70.44%
This article uses data from Football Reference to generate these predictions. If you’d like to read more content like this, please click the subscribe button below. You can also support The Linked Letters by sharing this article on social media.