

Is Economic Inequality Actually a Problem in MLB?
MLB owners might lockout players when the current collective bargaining agreement expires, but does the data support their arguments?


When I post my football articles ahead of the next weekend’s games, I often use stock photos of empty football stadiums because they’re easy to find. In contrast, it was surprisingly difficult to find a similar stock photo of an empty baseball stadium, though Substack has many photos of well-attended baseball games. But an empty seems appropriate for this article amid the threats of an MLB lockout following the 2026 season.
It appears likely that MLB will have a work stoppage in 2027, though it’s less certain whether it will result in any regular season games being missed. The last time regular season games were cancelled was during the strike that began in 1994 and also shortened the 1995 season to 144 games. One of the key issues now, as in 1994, is the economic disparity in baseball. It’s not just that large market teams can afford to spend more on players and player development, but there’s a growing perception that it’s becoming very difficult for smaller market teams to remain competitive with lower payrolls.
This isn’t a new issue, and although MLB has had labor peace for three decades, economic disparity nearly led to a strike in 2002. That was after a dominant run by the Yankees, who won four of five World Series from 1996-2000 and had the highest payroll in MLB in every season from 1996 onward with the single exception of 1998. MLB’s owners considered the economic model at the time so broken that they made plans for contraction. Although the owners planned to fold the Expos and Twins, several other small market teams like the Pirates and Royals were also in serious financial trouble. The disparity between the wealthiest MLB teams and the rest of the league has been an issue in MLB for decades and was also the main cause of the 1994 strike, which occurred in response to the owners demanding a salary cap and eliminate salary arbitration. And this same issue is behind the looming work stoppage after the 2026 season, including another attempt to impose a salary cap.
My goals with this article are to try to answer two questions:
Is economic inequality growing in baseball?
If so, does growing economic inequality make it difficult for small market teams to compete?
Economic inequality is also a common geopolitical issue, and the Gini coefficient is often used in this context to measure income inequality. MLB teams generally don’t like to share detailed financial data, and I’m not aware of a publicly available data set that could be used to examine trends in revenue inequality. However, the Gini coefficient can be used to measure inequality in any data set of this form, and team payrolls are publicly available.
I obtained opening day payroll data from 1988-2025 from The Baseball Cube and wrote Python code to calculate the Gini coefficient each season. I’m reluctant to just redistribute the data I obtained, especially since the The Baseball Cube also sells data. However, my source code for doing this analysis is freely available on Github. The input to my code is a single CSV file for all the seasons that I created manually by copying and pasting team payroll data. You’ll need a couple of Python libraries, SciPy and Matplotlib, to run the code.
A Gini coefficient of 1 indicates absolute equality, and this would occur if every team had the exact same opening day payroll. As the Gini coefficient gets closer to 0, it means that there is greater inequality. The lowest disparity in payrolls was before the mid-1990s, but inequality grew considerably during the second half of the 1990s and was greatest in 1999 when the Gini coefficient dipped to 0.7582. And 1999 remained the season with the greatest inequality until 2022 and 2023. Although there’s a lot of fluctuation in the Gini coefficient from season to season, it does appear that there is more inequality in MLB payrolls in the 2020s than in the previous decade.
Gini coefficient measures inequality, but I also want to know if teams with higher payrolls tend to win more games. For each season, I calculated the correlation coefficient between opening day payrolls and winning percentages. If the correlation coefficient is closer to 1, it means that teams with larger payrolls tended to win more games. This peaked in 1999, a time of high payroll inequality and during a run of four World Series victories in five seasons for the Yankees. However, this is also a very noisy metric, with a lot of variability from one season to the next.
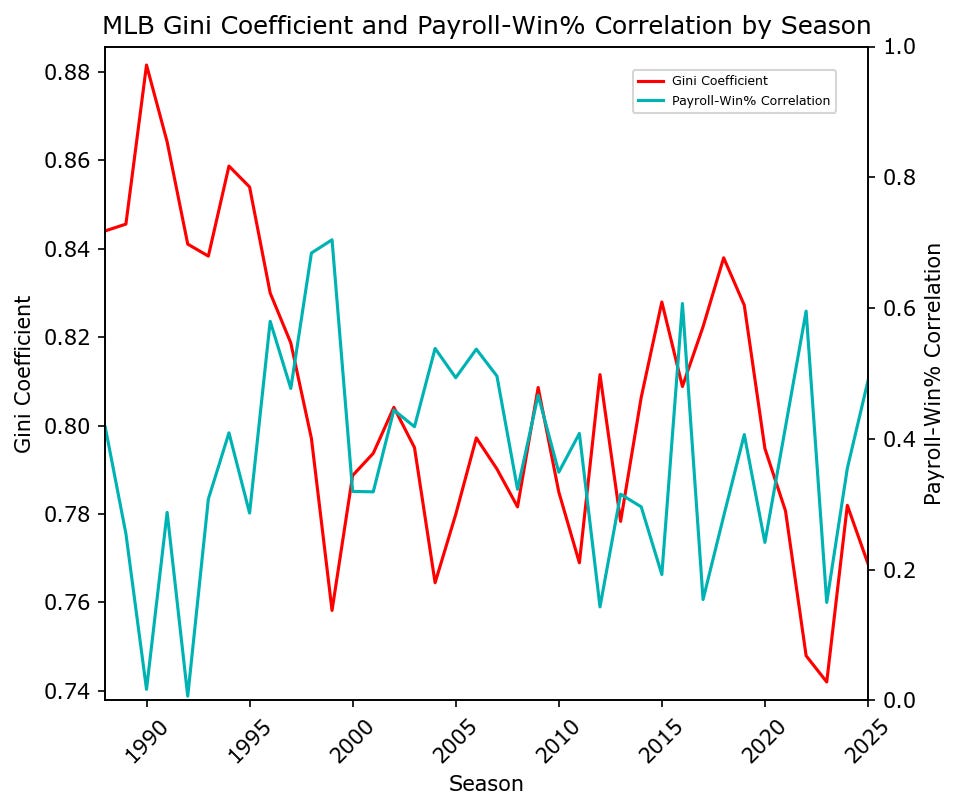
If economic inequality really poses a problem for smaller market teams and makes it difficult for them to be competitive, then seasons with larger economic inequality should also generally be seasons where the teams with higher payrolls win more games. To make the this more intuitive, I used 1 - Gini as a measure of economic inequality so that larger numbers indicate greater inequality. That’s the independent variable in the statistical relationship, and the dependent variable is the correlation between opening day payroll and winning percentage during that season. I took these independent and dependent variables and calculated the correlation coefficient from 1988-2025. Over that time period, the r-value is 0.4263 and the p-value is 0.0076. This suggests that there is a statistically significant relationship, and that growing economic inequality would appear to favor larger market teams with higher payrolls winning more games.
Gini Coefficient and Payroll-Win% Correlation by Season
1 - Gini Coefficient -> Payroll-Win% Correlation r-Value: 0.4263
1 - Gini Coefficient -> Payroll-Win% Correlation p-Value: 0.0076
Season Gini    Corr.   Teams Total Payroll   Mean Payroll
  1988 0.8441  0.4176  26    $294,880,320    $11,341,551
  1989 0.8456  0.2550  26    $350,909,782    $13,496,530
  1990 0.8816  0.0170  26    $454,422,925    $17,477,805
  1991 0.8642  0.2876  26    $630,008,474    $24,231,095
  1992 0.8411  0.0066  26    $783,893,948    $30,149,767
  1993 0.8383  0.3080  28    $856,648,188    $30,594,578
  1994 0.8587  0.4092  28    $884,936,262    $31,604,866
  1995 0.8540  0.2866  28    $882,082,040    $31,502,930
  1996 0.8300  0.5798  28    $895,178,844    $31,970,673
  1997 0.8187  0.4772  28    $1,061,631,360  $37,915,406
  1998 0.7971  0.6842  30    $1,210,532,333  $40,351,078
  1999 0.7582  0.7044  30    $1,445,119,433  $48,170,648
  2000 0.7887  0.3197  30    $1,686,271,795  $56,209,060
  2001 0.7937  0.3190  30    $1,962,841,814  $65,428,060
  2002 0.8041  0.4441  30    $2,024,680,522  $67,489,351
Season Gini    Corr.   Teams Total Payroll   Mean Payroll
  2003 0.7950  0.4186  30    $2,127,863,461  $70,928,782
  2004 0.7645  0.5383  30    $2,071,265,943  $69,042,198
  2005 0.7799  0.4935  30    $2,191,886,898  $73,062,897
  2006 0.7972  0.5372  30    $2,326,706,685  $77,556,890
  2007 0.7902  0.4960  30    $2,476,688,987  $82,556,300
  2008 0.7816  0.3230  30    $2,686,433,458  $89,547,782
  2009 0.8086  0.4668  30    $2,655,395,194  $88,513,173
  2010 0.7850  0.3490  30    $2,730,601,685  $91,020,056
  2011 0.7690  0.4083  30    $2,786,161,291  $92,872,043
  2012 0.8115  0.1430  30    $2,940,657,192  $98,021,906
  2013 0.7783  0.3154  30    $3,187,568,088  $106,252,270
  2014 0.8064  0.2961  30    $3,453,960,397  $115,132,013
  2015 0.8280  0.1925  30    $3,658,284,542  $121,942,818
  2016 0.8089  0.6071  30    $3,937,842,897  $131,261,430
  2017 0.8224  0.1544  30    $3,878,284,045  $129,276,135
Season Gini    Corr.   Teams Total Payroll   Mean Payroll
  2018 0.8380  0.2818  30    $4,141,041,635  $138,034,721
  2019 0.8272  0.4065  30    $4,007,869,480  $133,595,649
  2020 0.7948  0.2417  30    $3,735,758,835  $124,525,294
  2021 0.7807  0.4184  30    $3,825,147,026  $127,504,901
  2022 0.7479  0.5954  30    $4,200,988,230  $140,032,941
  2023 0.7420  0.1499  30    $4,451,414,228  $148,380,474
  2024 0.7820  0.3551  30    $4,906,571,671  $163,552,389
  2025 0.7688  0.4887  30    $5,075,316,630  $169,177,221
However, it’s not quite that simple, and it’s clear that the economics of MLB are significantly different from the mid-1990s onward. The Gini coefficient is considerably higher in the late 1980s and first half of the 1990s, but it never returns to those levels later in the data set. The Royals had the highest payroll in MLB in 1990. In 1991, the A’s had the highest payroll. Oakland and Kansas City aren’t exactly large markets. Teams in large markets like the Dodgers, Yankees, and Mets were often able to spend more money, but the economics weren’t skewed as much toward those large markets. It’s unthinkable in MLB’s current economic system that the Royals or A’s would have the highest payroll in the league. And that’s also a period when there didn’t appear to be as strong of a correlation between payroll and winning percentage. It’s clearly a different era, and it’s possible that the relatively high Gini coefficients during that era could skew the overall correlation coefficient.
Although it’s somewhat arbitrary to define a cutoff, I chose 1996 to be the first year that I considered somewhat representative of the modern economic structure of baseball. Owners illegally colluded during the 1980s to keep player salaries down and even tried to unilaterally impose a salary cap during the 1994-95 strike. The era after the strike seems much more representative of modern free agency, and the first full offseason under those conditions would have been after the 1995 season. It’s still a somewhat arbitrary cutoff, and there wasn’t a new collective bargaining agreement in place at that time, but I believe it makes sense. I ran the calculations again with the new cutoff, and the results are definitely different:
1 - Gini Coefficient -> Payroll-Win% Correlation r-Value: 0.2060
1 - Gini Coefficient -> Payroll-Win% Correlation p-Value: 0.2748
There’s still a positive correlation between payroll inequality and the tendency for higher payroll teams to win more games. But it’s a much lower correlation, and it no longer is statistically significant at any of the typical p-value thresholds. Yes, it’s intuitive that if there’s a larger divide between the wealthier and poorer teams, it’s harder for the poorer teams to win. This economic structure seems like it should favor large market teams like the Dodgers, Mets, and Yankees hoarding the top talent, thus greatly increasing their chances of winning. But the publicly available data I’ve used doesn’t seem to support that, at least not within the modern economics of baseball.
To be clear, a higher payroll does give a team a better chance of finishing the season with a good record. The correlation between opening day payroll and winning percentage was positive in every season from 1988 to 2025, so there is a definite statistical relationship between spending more money on players and finishing the season with a better record. However, it is not certain that widening the payroll gap between the wealthier and poorer teams gives the wealthy teams a significant competitive advantage beyond what they already have with the current economic inequality.
I can believe that MLB is currently in a period of large economic inequality between the wealthier and poorer teams, though the Gini coefficient data are somewhat noisy from one season to the next. But I’m not convinced that the data support radical changes to MLB’s economic model similar to those proposed during the 1994-95 labor dispute, especially policies like imposing a salary cap. Although it’s not generally referred to as a salary cap, the competitive balance tax could be viewed as a soft salary cap similar to the NBA’s old salary cap prior to the 2023 collective bargaining agreement, so MLB arguably already has a salary cap. Sure, if MLB reverted back to an economic structure similar to what existed before the 1994 strike, and if owners colluded to keep player salaries down, it probably would have a statistically significant impact on the data. But I’m just not convinced that such drastic measures are necessary for small market teams to complete or that the current economic model is seriously broken. The owners lost in their effort to impose a salary cap back in 1994, but there was long-term damage to baseball with diminished fan interest and lower attendance, not to mention long-term damage to franchises like the Montreal Expos. To be clear, MLB does need to address issues like revenue from broadcasting games amid the collapse of regional sports networks, and that has harmed teams financially, but it’s not clear that a salary cap would be preferable to adjusting the revenue sharing model. Is it really worth risking similar damage to baseball again when it’s not clear that there’s a real problem with player salaries? If the data clearly supported a different conclusion, I’d make the case for it, but it doesn’t.
If you found this article interesting and worth reading and you’d like to support The Linked Letters, please consider subscribing, sharing this article, and visiting my “about” page to learn how you can financially contribute to this publication. Thanks for reading!
This article uses data published by The Baseball Cube.