

Initial 2025 NFL Team Ratings and Week 1 Predictions
How have the ratings changed since the end of the 2024 season?

It feels like just yesterday that it was Memorial Day weekend, summer was just beginning, and I was watching the Monaco Grand Prix, Indy 500, and Coca-Cola 600 on the greatest day in motorsports. Summer went by in a flash and now it's time for the start of the NFL season. That means, of course, that I need to post some team ratings and predictions for week 1.
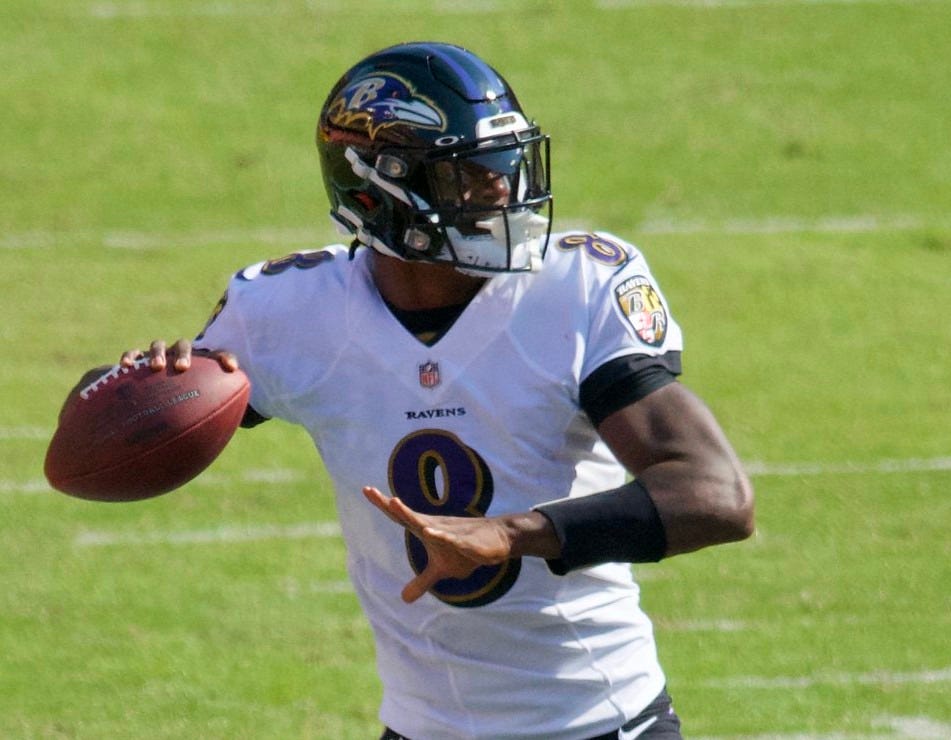
Lamar Jackson’s Baltimore Ravens top the initial 2025 ratings, and it’s not close. Can Jackson lead the Ravens to a Super Bowl victory this season?
How Early Season Ratings Work
My early tests of college football ratings have given me much to ponder about which games should influence a team's rating the most. For the most part, I want recent games to impact a team's rating more than older games because I want to know how good a team is right now. My experiments with college football ratings should have some relevance to NFL games because I'm using the same algorithm for both.
There are a lot of roster changes during an NFL offseason, so a team's performance last season doesn't necessarily reflect how good they are right now. Preseason games also aren't always a good indicator of a team's skill because starters often don't play a lot during those games. A great example of this is the 1999 St. Louis Rams, who had finished 4-12 the previous season and lost their newly-acquired starting quarterback Trent Green to a season-ending injury during the preseason. The Rams had made numerous roster upgrades during the offseason and Isaac Bruce returned from being injured in 1998, but even the preseason games didn't reflect the skill of that team. The Rams were 2-2 in the preseason, but losing Green in the third preseason game appeared to be a serious blow to their chances of improving significantly over 4-12. I’m not sure there’s any computer rating system that would have any hope of accurately predicting that team’s season.
Heading into week 1, how much should the preseason matter compared to last season? With three preseason games and 17 games the prior season, if I weight each preseason game at 80% and each game last season at 100%, the preseason only accounts for roughly 12.4% of a team's rating. That was my original plan, but the influence of the preseason seems low to me. Even if I weight preseason games equally to the games last season, the preseason only accounts for 15% of the rating. Again, that seems to be on the low side if preseason games might better reflect the skill of the current roster. Heading into week 1, I'm going to weight the preseason games at 100% and prior season games at 50%. The result is that preseason games will account for roughly 26.1% of a team's current rating, with the prior season making up the other 73.9%. It's a bit more balanced.
This will obviously need to be adjusted in subsequent weeks. If I kept this weighting the same and then added in week 1 of the regular season, that game would only account for 8% of the current rating. That seems pretty low, and it is our first really good look at the quality of NFL teams in 2025. For now, my plan after week 1 is to weight preseason games at 40% and games last season at 20%, then taper those to zero over ten weeks. This means the week 1 game will account for approximately 17.9% of a team's rating, the preseason for 21.4%, and last season for the remaining 60.7%. That seems more reasonable to me. If I taper those weights to zero, current season games will account for 55.4% of a team's rating after week 4 and 79.2% after week 7. I don't know what the right answer is, but those percentages intuitively seem somewhat reasonable.
Final 2024 Ratings
Before I post any 2025 ratings, it's probably good to look at where teams finished in 2024. This only includes regular season and postseason games, not anything from the preseason.
Overall Ratings
Home advantage: 1.99 points
Mean score: 22.21 points
Rank Rating Team                  Offense Defense        SOS Future SOS
   1 12.09  Detroit Lions         10.35   1.72     0.90 (10)        ---
   2 10.43  Baltimore Ravens      7.88    2.54      1.19 (5)        ---
   3 10.14  Philadelphia Eagles   5.27    4.84    -0.63 (26)        ---
   4 9.45   Buffalo Bills         8.28    1.16     0.04 (19)        ---
   5 7.94   Green Bay Packers     4.26    3.67      1.52 (3)        ---
   6 5.77   Tampa Bay Buccaneers  5.00    0.76    -0.38 (24)        ---
   7 4.94   Minnesota Vikings     1.90    3.05     0.38 (16)        ---
   8 4.82   Washington Commanders 6.03    -1.26    0.36 (17)        ---
   9 4.52   Denver Broncos        0.57    3.94     0.02 (20)        ---
  10 4.32   Kansas City Chiefs    0.89    3.42      1.06 (7)        ---
  11 3.47   Los Angeles Chargers  -0.22   3.70    -0.83 (30)        ---
  12 1.96   Arizona Cardinals     0.79    1.20      0.93 (8)        ---
  13 1.87   Pittsburgh Steelers   -1.02   2.91     0.82 (11)        ---
  14 1.55   Cincinnati Bengals    4.84    -3.32   -0.85 (31)        ---
  15 1.43   Los Angeles Rams      0.12    1.32      1.73 (1)        ---
  16 1.21   Seattle Seahawks      -0.16   1.37     0.80 (12)        ---
  17 0.59   Houston Texans        -0.94   1.47    -0.16 (21)        ---
  18 -0.87  San Francisco 49ers   1.10    -1.99     1.65 (2)        ---
  19 -2.51  Chicago Bears         -4.97   2.50      1.11 (6)        ---
  20 -2.55  Atlanta Falcons       -0.39   -2.16   -0.39 (25)        ---
Rank Rating Team                  Offense Defense        SOS Future SOS
  21 -2.65  Miami Dolphins        -3.34   0.69    -1.65 (32)        ---
  22 -3.40  Indianapolis Colts    -0.28   -3.14   -0.78 (29)        ---
  23 -4.26  New York Jets         -2.85   -1.43   -0.27 (22)        ---
  24 -4.53  New Orleans Saints    -4.07   -0.48   -0.66 (28)        ---
  25 -5.89  Dallas Cowboys        -2.43   -3.47     0.92 (9)        ---
  26 -7.08  Las Vegas Raiders     -4.27   -2.79    0.60 (14)        ---
  27 -7.11  Jacksonville Jaguars  -3.93   -3.13   -0.64 (27)        ---
  28 -8.01  New York Giants       -7.40   -0.57    0.64 (13)        ---
  29 -8.33  New England Patriots  -6.05   -2.29   -0.31 (23)        ---
  30 -8.62  Tennessee Titans      -4.76   -3.88    0.51 (15)        ---
  31 -9.80  Cleveland Browns      -7.57   -2.20     1.28 (4)        ---
  32 -10.75 Carolina Panthers     -2.69   -8.12    0.16 (18)        ---
For NFL ratings, schedule strength (SOS) is just the average rating of a team’s opponents, adjusting for the site of a game. The majority of the schedule strengths are positive for 2024 because they include the influence of postseason games, and those usually playing against involve above-average opponents. For NFL games, I’m not going to get into a lot of detail about schedule strength, but I’ll certainly do that for college football as the season goes along.
2025 Ratings If Preseason Games Matter a Little
My original approach to rating teams would have resulted in the preseason only accounting for 12.4% of a team's rating, which I suggested was low. This is more akin to my approach for college football, which I’m also considering changing, and it might well be too conservative. Here's what those ratings would look like:
Overall Ratings
Home advantage: 1.85 points
Mean score: 21.99 points
Rank Rating Team                  Offense Defense        SOS Future SOS
   1 11.13  Baltimore Ravens      7.55    3.54     0.57 (13)  0.57 (13)
   2 8.25   Philadelphia Eagles   4.46    3.75      1.31 (9)   1.31 (9)
   3 8.19   Detroit Lions         7.39    0.81      2.08 (2)   2.08 (2)
   4 7.54   Buffalo Bills         7.42    0.12    -1.09 (22) -1.09 (22)
   5 6.26   Green Bay Packers     3.31    2.95      1.47 (6)   1.47 (6)
   6 5.92   Denver Broncos        1.50    4.41    -0.50 (18) -0.50 (18)
   7 5.57   Tampa Bay Buccaneers  4.25    1.30    -1.39 (28) -1.39 (28)
   8 4.59   Los Angeles Chargers  0.84    3.75    -0.36 (17) -0.36 (17)
   9 3.47   Minnesota Vikings     0.94    2.54      2.18 (1)   2.18 (1)
  10 3.14   Kansas City Chiefs    1.08    2.11     1.13 (11)  1.13 (11)
  11 2.15   Pittsburgh Steelers   -0.85   3.05      1.54 (4)   1.54 (4)
  12 1.97   Washington Commanders 4.53    -2.54    1.01 (12)  1.01 (12)
  13 1.70   Houston Texans        -1.10   2.79    -0.02 (15) -0.02 (15)
  14 1.70   Cincinnati Bengals    5.00    -3.36     1.39 (7)   1.39 (7)
  15 1.15   Arizona Cardinals     0.03    1.13    -1.45 (29) -1.45 (29)
  16 1.01   Seattle Seahawks      -0.23   1.22    -1.12 (24) -1.12 (24)
  17 0.68   Los Angeles Rams      0.13    0.52     0.09 (14)  0.09 (14)
  18 -1.11  Miami Dolphins        -2.53   1.47    -0.55 (19) -0.55 (19)
  19 -1.13  Chicago Bears         -3.25   2.14      1.89 (3)   1.89 (3)
  20 -1.43  San Francisco 49ers   0.89    -2.36   -2.08 (32) -2.08 (32)
Rank Rating Team                  Offense Defense        SOS Future SOS
  21 -1.59  Indianapolis Colts    0.35    -1.93   -1.22 (25) -1.22 (25)
  22 -3.13  New York Jets         -2.24   -0.87   -0.97 (21) -0.97 (21)
  23 -3.91  Atlanta Falcons       -1.58   -2.30   -1.11 (23) -1.11 (23)
  24 -4.96  New Orleans Saints    -4.04   -0.94   -2.03 (31) -2.03 (31)
  25 -5.06  New York Giants       -4.84   -0.24    1.29 (10)  1.29 (10)
  26 -5.74  Dallas Cowboys        -2.06   -3.69     1.33 (8)   1.33 (8)
  27 -6.08  Las Vegas Raiders     -3.92   -2.11   -0.27 (16) -0.27 (16)
  28 -6.51  Jacksonville Jaguars  -3.52   -2.99   -1.26 (26) -1.26 (26)
  29 -6.79  New England Patriots  -4.59   -2.21   -1.28 (27) -1.28 (27)
  30 -7.46  Cleveland Browns      -6.44   -0.97     1.54 (5)   1.54 (5)
  31 -7.73  Tennessee Titans      -4.47   -3.26   -1.46 (30) -1.46 (30)
  32 -11.87 Carolina Panthers     -3.95   -7.85   -0.75 (20) -0.75 (20)
I’m mainly including these for reference to show in more detail why I’m weighting preseason games more, and how it affects the ratings.
2025 NFL Ratings for Week 1
Now, let's look at the real week 1 ratings. This time, the preseason is responsible for approximately 26.1% of a team's rating with 2024 accounting for the remaining 73.9%.
Overall Ratings
Home advantage: 1.85 points
Mean score: 21.99 points
Rank Rating Team                  Offense Defense        SOS Future SOS
   1 11.86  Baltimore Ravens      7.15    4.73     0.59 (13)  0.59 (13)
   2 7.34   Denver Broncos        2.49    4.88    -0.36 (18) -0.36 (18)
   3 6.51   Philadelphia Eagles   3.61    2.84      1.04 (9)   1.04 (9)
   4 5.28   Buffalo Bills         6.22    -0.98   -0.76 (20) -0.76 (20)
   5 5.25   Tampa Bay Buccaneers  3.43    1.87    -1.99 (32) -1.99 (32)
   6 5.24   Los Angeles Chargers  1.54    3.70    -0.10 (16) -0.10 (16)
   7 4.83   Green Bay Packers     2.29    2.57      1.20 (8)   1.20 (8)
   8 4.47   Detroit Lions         4.68    -0.19     1.95 (1)   1.95 (1)
   9 2.43   Houston Texans        -1.36   3.77     0.29 (15)  0.29 (15)
  10 2.12   Minnesota Vikings     -0.03   2.13      1.83 (3)   1.83 (3)
  11 2.04   Pittsburgh Steelers   -0.79   2.83      1.87 (2)   1.87 (2)
  12 1.62   Kansas City Chiefs    1.04    0.58      1.34 (6)   1.34 (6)
  13 1.15   Cincinnati Bengals    4.91    -3.78     1.71 (4)   1.71 (4)
  14 0.79   Seattle Seahawks      -0.22   1.03    -1.46 (28) -1.46 (28)
  15 0.52   Chicago Bears         -1.42   1.96      1.23 (7)   1.23 (7)
  16 0.48   Arizona Cardinals     -0.85   1.33    -1.60 (29) -1.60 (29)
  17 0.47   Indianapolis Colts    1.28    -0.79   -0.99 (25) -0.99 (25)
  18 0.36   Los Angeles Rams      0.39    -0.02   -0.26 (17) -0.26 (17)
  19 0.27   Miami Dolphins        -1.84   2.11    -0.50 (19) -0.50 (19)
  20 -0.75  Washington Commanders 3.05    -3.83    0.99 (11)  0.99 (11)
Rank Rating Team                  Offense Defense        SOS Future SOS
  21 -1.53  New York Giants       -2.02   0.46     0.61 (12)  0.61 (12)
  22 -1.85  New York Jets         -1.69   -0.14   -0.78 (21) -0.78 (21)
  23 -1.86  San Francisco 49ers   0.84    -2.68   -1.68 (30) -1.68 (30)
  24 -4.62  Cleveland Browns      -5.10   0.50      1.44 (5)   1.44 (5)
  25 -5.23  New England Patriots  -3.01   -2.18   -0.96 (24) -0.96 (24)
  26 -5.44  New Orleans Saints    -3.98   -1.45   -1.97 (31) -1.97 (31)
  27 -5.54  Dallas Cowboys        -1.60   -3.95    0.99 (10)  0.99 (10)
  28 -5.58  Atlanta Falcons       -2.96   -2.64   -1.39 (27) -1.39 (27)
  29 -5.62  Las Vegas Raiders     -3.83   -1.81    0.37 (14)  0.37 (14)
  30 -5.82  Jacksonville Jaguars  -3.12   -2.68   -0.84 (22) -0.84 (22)
  31 -6.67  Tennessee Titans      -3.97   -2.68   -0.86 (23) -0.86 (23)
  32 -12.63 Carolina Panthers     -5.24   -7.43   -1.06 (26) -1.06 (26)
There are definitely a few significant shifts from 2024. Detroit is still ranked in the top 10, but they've fallen a lot from their 2024 rating, and their schedule is also rated the toughest in the NFL. Washington is another team that fell considerably because of their preseason games. The New York Giants are a big winner, and Cleveland has also risen considerably with their preseason performance. Playing the fifth toughest schedule according to these ratings won’t do the Browns any favors in their quest to make the playoffs, however.
Kansas City is another big question mark for me. They're ranked #12 here and will play a relatively tough schedule. But they were ranked #10 last season and made it all the way to the Super Bowl. Why were they only ranked #10 last season despite going 15-2 in the regular season? The answer is their +59 point differential during the regular season. They won a lot of games, but a lot of those wins were in close games. By comparison, 15-2 Detroit had a +222 point differential, boosting them to the top of the ratings. Was Kansas City lucky, or was there just a lot of skill in winning many close games? The point differential was hurt by a 38-0 shutout loss in the final weekend of the season, so it’s not quite as weak as it initially appears. But they also weren't nearly as dominant offensively as their 2022 team. There’s a lot of luck in football, and it doesn’t always even out over the course of an 18 week season. In contrast to last season, the 2023 team went just 11-6 with a +77 point differential. Baltimore is definitely the favorite in the AFC, and I expect Kansas City to finish closer to their 2023 record.
Week 1 Predictions
Let's get to the week 1 predictions. The thresholds for close games, blowouts, and high and low scoring games are different in the NFL than in college football. That's because NFL teams are balanced enough in talent to usually avoid truly lopsided scores and there's just less scoring overall.
Games are ranked based on the projected quality. This factors in the overall strength of the two teams and the potential for a competitive game. Game quality ratings are not directly comparable between college football and the NFL for many of the same reasons I just mentioned. This is just for predicting which NFL games are most and least compelling each weekend.
Beside each team, there are two numbers in parentheses. One is the predicted margin of victory (positive) or defeat (negative), the other is the probability of winning. In the event that a margin is larger than what's indicated by the predicted score, that's because there's nothing in the math that prevents a forecast of negative points with a sufficiently lopsided matchup. This isn't even close to possible with the current NFL ratings, even with the weakest offense against the strongest defense, but it does occur once in awhile in college football. A negative score is impossible, of course, so the score would be set to zero in those instances. However, there's no upper limit on how many points a team can be projected to score. But with more parity between NFL teams, even the highest scoring predictions aren’t going to be nearly as crazy as what is possible with the college football ratings.
#1: Baltimore Ravens (4.73, 64.24%) at Buffalo Bills (-4.73, 35.35%), Tie (0.41%)
Estimated score: 29.20 - 24.41, Total: 53.60
Quality: 93.91%, Team quality: 93.78%, Competitiveness: 94.17%
Blowout probability (margin >= 17.0 pts): 21.25%
Close game probability (margin <= 4.0 pts): 23.02%
High scoring probability (total >= 54.0 pts): 48.84%
Low scoring probability (total <= 33.0 pts): 6.68%

#2: Detroit Lions (-2.21, 42.90%) at Green Bay Packers (2.21, 56.67%), Tie (0.43%)
Estimated score: 23.18 - 25.40, Total: 48.58
Quality: 86.92%, Team quality: 81.58%, Competitiveness: 98.69%
Blowout probability (margin >= 17.0 pts): 18.95%
Close game probability (margin <= 4.0 pts): 24.25%
High scoring probability (total >= 54.0 pts): 34.65%
Low scoring probability (total <= 33.0 pts): 12.83%

#3: Kansas City Chiefs (-5.47, 33.22%) at Los Angeles Chargers (5.47, 66.38%), Tie (0.40%)
Estimated score: 18.40 - 23.87, Total: 42.27
Quality: 77.01%, Team quality: 70.35%, Competitiveness: 92.28%
Blowout probability (margin >= 17.0 pts): 22.23%
Close game probability (margin <= 4.0 pts): 22.51%
High scoring probability (total >= 54.0 pts): 19.64%
Low scoring probability (total <= 33.0 pts): 24.99%

#4: Houston Texans (0.22, 50.47%) at Los Angeles Rams (-0.22, 49.09%), Tie (0.44%)
Estimated score: 19.73 - 19.54, Total: 39.27
Quality: 71.90%, Team quality: 60.97%, Competitiveness: 99.99%
Blowout probability (margin >= 17.0 pts): 18.30%
Close game probability (margin <= 4.0 pts): 24.60%
High scoring probability (total >= 54.0 pts): 14.16%
Low scoring probability (total <= 33.0 pts): 32.41%

#5: Minnesota Vikings (-0.25, 48.99%) at Chicago Bears (0.25, 50.57%), Tie (0.44%)
Estimated score: 19.08 - 19.36, Total: 38.44
Quality: 71.47%, Team quality: 60.43%, Competitiveness: 99.98%
Blowout probability (margin >= 17.0 pts): 18.30%
Close game probability (margin <= 4.0 pts): 24.60%
High scoring probability (total >= 54.0 pts): 12.85%
Low scoring probability (total <= 33.0 pts): 34.60%

#6: Miami Dolphins (-2.05, 43.39%) at Indianapolis Colts (2.05, 56.18%), Tie (0.43%)
Estimated score: 20.02 - 22.09, Total: 42.10
Quality: 64.67%, Team quality: 52.30%, Competitiveness: 98.87%
Blowout probability (margin >= 17.0 pts): 18.86%
Close game probability (margin <= 4.0 pts): 24.29%
High scoring probability (total >= 54.0 pts): 19.31%
Low scoring probability (total <= 33.0 pts): 25.37%

#7: Pittsburgh Steelers (2.04, 56.14%) at New York Jets (-2.04, 43.43%), Tie (0.43%)
Estimated score: 20.41 - 18.39, Total: 38.81
Quality: 62.85%, Team quality: 50.11%, Competitiveness: 98.89%
Blowout probability (margin >= 17.0 pts): 18.85%
Close game probability (margin <= 4.0 pts): 24.30%
High scoring probability (total >= 54.0 pts): 13.43%
Low scoring probability (total <= 33.0 pts): 33.62%

#8: San Francisco 49ers (-4.50, 36.00%) at Seattle Seahawks (4.50, 63.59%), Tie (0.41%)
Estimated score: 20.87 - 25.37, Total: 46.24
Quality: 55.82%, Team quality: 42.86%, Competitiveness: 94.69%
Blowout probability (margin >= 17.0 pts): 20.98%
Close game probability (margin <= 4.0 pts): 23.16%
High scoring probability (total >= 54.0 pts): 28.60%
Low scoring probability (total <= 33.0 pts): 16.74%

#9: New York Giants (-2.63, 41.62%) at Washington Commanders (2.63, 57.95%), Tie (0.43%)
Estimated score: 22.88 - 25.51, Total: 48.39
Quality: 54.04%, Team quality: 40.09%, Competitiveness: 98.16%
Blowout probability (margin >= 17.0 pts): 19.22%
Close game probability (margin <= 4.0 pts): 24.10%
High scoring probability (total >= 54.0 pts): 34.13%
Low scoring probability (total <= 33.0 pts): 13.12%

#10: Cincinnati Bengals (3.91, 61.83%) at Cleveland Browns (-3.91, 37.76%), Tie (0.42%)
Estimated score: 25.48 - 21.59, Total: 47.07
Quality: 48.58%, Team quality: 34.56%, Competitiveness: 95.97%
Blowout probability (margin >= 17.0 pts): 20.33%
Close game probability (margin <= 4.0 pts): 23.51%
High scoring probability (total >= 54.0 pts): 30.69%
Low scoring probability (total <= 33.0 pts): 15.27%

#11: Tampa Bay Buccaneers (8.98, 75.75%) at Atlanta Falcons (-8.98, 23.91%), Tie (0.34%)
Estimated score: 27.13 - 18.09, Total: 45.21
Quality: 48.55%, Team quality: 37.71%, Competitiveness: 80.49%
Blowout probability (margin >= 17.0 pts): 28.59%
Close game probability (margin <= 4.0 pts): 19.36%
High scoring probability (total >= 54.0 pts): 26.11%
Low scoring probability (total <= 33.0 pts): 18.68%

#12: Arizona Cardinals (4.07, 62.31%) at New Orleans Saints (-4.07, 37.28%), Tie (0.42%)
Estimated score: 21.66 - 17.61, Total: 39.27
Quality: 43.39%, Team quality: 29.22%, Competitiveness: 95.64%
Blowout probability (margin >= 17.0 pts): 20.49%
Close game probability (margin <= 4.0 pts): 23.42%
High scoring probability (total >= 54.0 pts): 14.16%
Low scoring probability (total <= 33.0 pts): 32.41%

#13: Dallas Cowboys (-13.91, 13.68%) at Philadelphia Eagles (13.91, 86.08%), Tie (0.24%)
Estimated score: 16.62 - 30.47, Total: 47.10
Quality: 37.90%, Team quality: 30.27%, Competitiveness: 59.40%
Blowout probability (margin >= 17.0 pts): 41.20%
Close game probability (margin <= 4.0 pts): 13.85%
High scoring probability (total >= 54.0 pts): 30.75%
Low scoring probability (total <= 33.0 pts): 15.23%

#14: Tennessee Titans (-15.86, 10.60%) at Denver Broncos (15.86, 89.20%), Tie (0.20%)
Estimated score: 12.21 - 28.08, Total: 40.29
Quality: 31.51%, Team quality: 24.83%, Competitiveness: 50.76%
Blowout probability (margin >= 17.0 pts): 46.95%
Close game probability (margin <= 4.0 pts): 11.65%
High scoring probability (total >= 54.0 pts): 15.90%
Low scoring probability (total <= 33.0 pts): 29.78%

#15: Las Vegas Raiders (-2.24, 42.81%) at New England Patriots (2.24, 56.76%), Tie (0.43%)
Estimated score: 19.41 - 21.71, Total: 41.12
Quality: 26.43%, Team quality: 13.68%, Competitiveness: 98.66%
Blowout probability (margin >= 17.0 pts): 18.96%
Close game probability (margin <= 4.0 pts): 24.24%
High scoring probability (total >= 54.0 pts): 17.41%
Low scoring probability (total <= 33.0 pts): 27.71%

#16: Carolina Panthers (-8.66, 24.70%) at Jacksonville Jaguars (8.66, 74.95%), Tie (0.35%)
Estimated score: 18.50 - 27.22, Total: 45.72
Quality: 7.70%, Team quality: 2.36%, Competitiveness: 81.73%
Blowout probability (margin >= 17.0 pts): 27.90%
Close game probability (margin <= 4.0 pts): 19.69%
High scoring probability (total >= 54.0 pts): 27.33%
Low scoring probability (total <= 33.0 pts): 17.71%
These predictions are going to be less accurate early in the season, but I’m hopeful that there’s still some significant skill even in week 1. I plan to evaluate the accuracy of my rating system in the future, but I’d like to wait until later in the 2025 season when the ratings should be more accurate.
Data used to calculate the ratings was obtained from Pro Football Reference.