

College Football Ratings and Week 3 Predictions
Analysis of some of the big moves up and down in the ratings from last week

Week 3 of college football gets underway this evening. I'm posting these ratings a bit later than I'd planned, and that's because I'm still making minor tweaks to the algorithm. Two of the most shocking results in the first weekend were Alabama losing in Tallahassee and South Florida’s upset over Boise State. I’ll take a look at how those teams fared in this week’s ratings and the factors that might be affected their ratings. I’ll also talk about the revival of the Border War and a big move in the ratings by another former Big 8 rival.
My first impression is that my original scheme for weighting last season's games against this season is just too conservative. I'll continue to post both sets of ratings until week 6, after which the ratings will be entirely based on this season's games.
I'm going to post the ratings using my original scheme in this article, where this season's games would account for approximately 16.13% of a team's rating and last year would account for the remaining 83.87%. Like I said, based on the preliminary results, I believe that this is probably too conservative in adjusting teams from last year's ratings.
I’ll post the alternative ratings separately, but most of the discussion will be in this article.
Tracking Florida State
The biggest thing I'm tracking right now is how the ratings handle Florida State, a team that's likely to move significantly from their preseason rating. These ratings have Florida State at #65, which seems too low. Still, it's a jump of 14 spots from last week's ratings. Last week's rating was 42.98 for Florida State, and it’s now jumped over three points to 46.31. This comes after a 74 point win over East Texas A&M. In last week's ratings, the Lions were ranked #89 out of 129 FCS teams, with a rating of 9.10. Add in the home advantage, and Florida State was favored by 36.42 points.
Subjectively, analysts and commentators often don't pay a whole lot of attention to blowouts over FCS opponents. However, the Seminoles won by roughly five touchdowns more than the previous computer ratings predicted. Even against lesser competition, the margin of victory in blowouts does provide some useful information about the quality of teams. If Florida State had won by a margin like 41-3, it would still have been a blowout, but it wouldn't have shifted the ratings in any significant way. By the way, there's a similar adjustment to the FCS ratings, where East Texas A&M's rating dropped to 5.52, and they're now ranked #97 among FCS teams. In the alternative ratings that I'll be posting, East Texas A&M's rating is 4.89, and they're also rated #97 among FCS teams.
For a 13 game schedule last year in the alternative ratings, last season's games account for roughly 50.98% of a team's rating and this season's games are responsible for the remaining 49.02%. In the case of the Lions, splitting the influence of the seasons roughly 50-50 like this doesn't change their rating much. For Florida State, it's a much bigger difference, where they're ranked #21 in the alternative ratings with a 58.69 rating. The Lions' blowout loss to the Seminoles is somewhat balanced by outperforming the prediction of the computer ratings in week 1, only losing by 29 points at SMU. That helps to mitigate the impact of losing to Florida State, and their rating doesn't change that much depending on how much or little I weight this season's games. A week ago, the Lions actually got a big boost in the alternative ratings following a strong performance against SMU, where they had been ranked #65 in the FCS at 16.72, which since dropped almost 12 points after losing to the Seminoles. The two games largely cancel out for the Lions. However, the Seminoles have significantly outperformed the preseason ratings both by an emphatic win over Alabama and then the blowout last week, and may well continue to climb in the ratings.
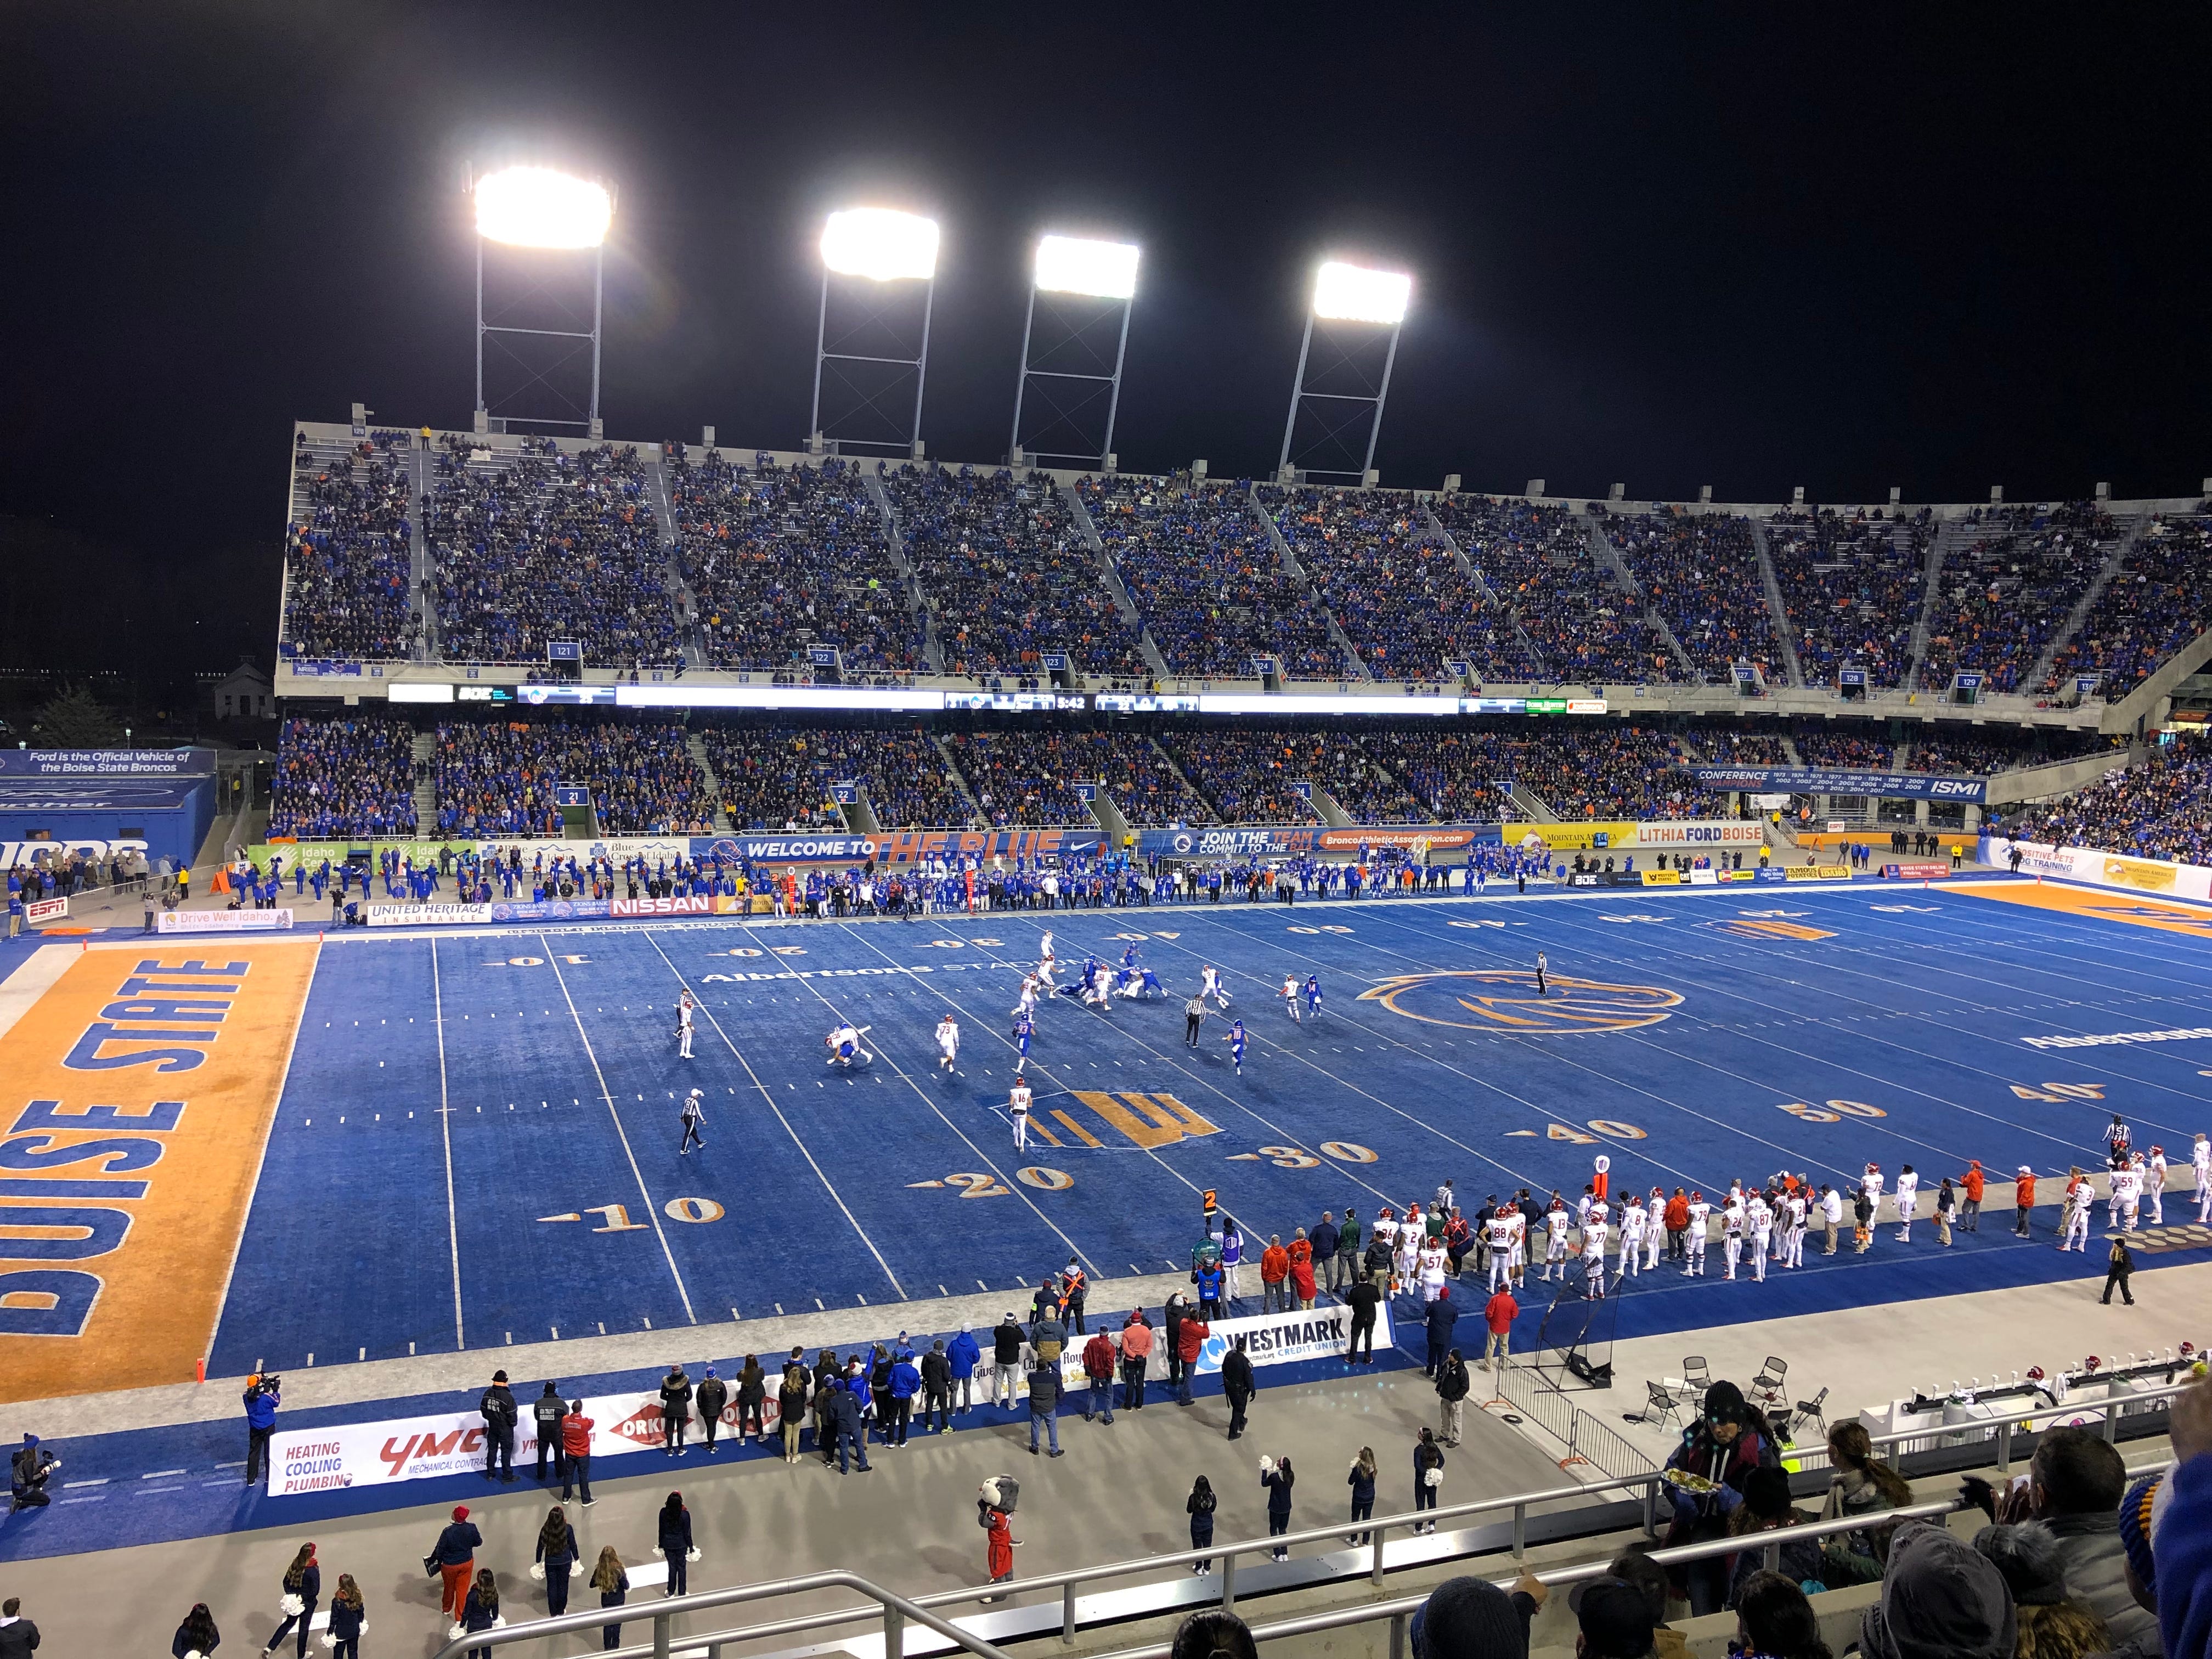
Boise State and South Florida
The other big surprise in week 1 was South Florida defeating Boise State. The Broncos certainly earned their spot in the playoff last year based on their resume of winning games and their only loss being by three points at Oregon. As a reminder, making it to the playoff is generally based on what a team accomplished by winning games, not based on estimate of a team's quality or a prediction of their future performance. The 2023 Florida State Seminoles will disagree, and they're right about what happened that season. But playoff bids are mostly supposed to be based on what a team has accomplished in the past. Anyway, the Broncos had an excellent strength of record last season. However, predictive ratings weren't all that impressed, an example of which is Boise State being ranked #27 in ESPN's FPI at the end of the season.
The Broncos won by 37 over Eastern Washington last weekend. Regardless of whether you look at the original rating scheme or the alternative ratings, the computer preferred the blue turf over red turf and predicted Boise State to win by somewhere around four touchdowns. They outperformed this a bit, and their rating has recovered a bit this week after the loss to South Florida.
South Florida's win last weekend was another upset, with the previous ratings having Florida favored over the Bulls by roughly three touchdowns, and the alternative ratings making the Gators approximately 16 point favorites. It's a significant upset no matter what, but the extent of South Florida's rise in the ratings again depends on how much weight is given to this season’s games. FPI ranks the Bulls at #38 while Bill Connelly's SP+ puts them at #63. Jeff Sagarin's pure points rating also has the Bulls at #63 right now. My ratings put the Bulls at #69, which is on the low end, while the alternative rating raises them all the way to #36. Although I think there's pretty good consensus that Florida State belongs somewhere around #25, give or take a few spots, there's no consensus on what to do with the Bulls.
Former Big 8 Rivals
Outside Missouri and Kansas, it seems like the Border War is viewed more as a basketball rivalry than a football one, and not as big of a rivalry game as the Iron Bowl, Nebraska-Oklahoma, or Michigan-Ohio State. But these teams and their fans absolutely despise each other. Make no mistake, even though these teams hadn't played in more than a decade, the fans still haven't forgotten how bitter this rivalry truly is. A Mizzou fan had the opportunity to kick a 45 yard field goal for a $25,000 prize. He passed up that chance and kicked the ball at the Kansas sideline to show his disdain for the Jayhawks. College football is better with these rivalry games, and games like this also provide a good early season test for where teams belong in the ratings.
Giving more weight to 2025 games had the effect of increasing Missouri's predicted margin of victory in the Border War. The original ratings had them favored around four points while the alternative ratings were closer to an eight point margin. After struggling early, the Tigers came back to win by 11. The computers now tend to have Missouri ranked around #15, give or take a couple of spots. My ratings are on the low end, with Mizzou at #23, but the alternative ratings give more weight to 2025 games and put the Tigers at #16. This game did raise Missouri a bit in the ratings and drop Kansas a few spots, and I viewed it as one test for how much weight to give this season's games. It seems to be a win for the alternative ratings, though it’s just a single data point. However, the margin just wasn't large enough to shift the computer ratings that much. The computers already knew the Tigers were a pretty good team, so this mainly affirmed that they were a little better than their previous rating.
It's a bit more surprising to me that another former Big 12 rival, Nebraska, is ranked alongside Missouri in some ratings. FPI has Missouri at #13 and Nebraska at #12. My ratings have the teams at #23 and #30, respectively. However, my alternative ratings have Missouri at #16 and Nebraska one spot above at #15. SP+ and Jeff Sagarin's predictor both put Nebraska at #28, however. Unlike the general consensus to move Missouri to roughly #15, the computers haven't yet decided quite where to rank Nebraska. Their rise in the ratings is almost certainly the result of a 68 point victory over the Akron Zips and not something else influencing the numbers. The effect of the Akron-Nebraska game on my ratings is fairly similar to my analysis of Florida State's rise in the ratings. It's not that Akron was predicted to be a competitive opponent, but when a team is predicted to win by roughly five touchdowns and actually wins by nearly 10 touchdowns, it can still move the ratings quite a bit early in the season.
Subjectively, we usually don't give too much attention to early season blowout wins over lesser competition. But just as the magnitude of blowout wins is useful to distinguish between the quality of teams across different divisions, I believe it's also useful here as well. Does Nebraska belong in the top 20? While my allegiance to a former conference rival makes it difficult for me to say so, I believe this rating probably is justified. We'll get a much better idea next weekend when they play Michigan. Here are predictions for that game using the original and alternative ratings:
Original Ratings
#4: Michigan (-2.66, 41.77%) at Nebraska (2.66, 58.23%)
Estimated score: 15.57 - 18.28, Total: 33.85
Quality: 97.04%, Team quality: 96.15%, Competitiveness: 98.84%
Blowout probability (margin >= 30.0 pts): 2.18%
Close game probability (margin <= 7.0 pts): 40.71%
High scoring probability (total >= 66.0 pts): 18.75%
Low scoring probability (total <= 38.0 pts): 54.56%

Alternative Ratings
#11: Michigan (-9.64, 24.75%) at Nebraska (9.64, 75.25%)
Estimated score: 14.13 - 24.01, Total: 38.14
Quality: 93.02%, Team quality: 96.37%, Competitiveness: 86.67%
Blowout probability (margin >= 30.0 pts): 8.01%
Close game probability (margin <= 7.0 pts): 30.50%
High scoring probability (total >= 66.0 pts): 21.63%
Low scoring probability (total <= 38.0 pts): 49.84%
Both ratings have Michigan just below #30, but they don't quite agree on Nebraska's rating. But it wouldn't surprise me at all if Nebraska won comfortably against Michigan.
The Ratings
From what I can tell, giving more weight to the early season games generally seems to improve the ratings, especially where there's a big difference positively or negatively from the prior season. I generally consider them to be a better approximation of a team's quality at this point in the season. I'll continue to post both sets of ratings and predictions for the next three weeks. After that, the ratings will be based solely on games played this season, so there will only be one set of ratings. Because this is already a long article, I'm going to post the standard ratings here, then I'll post the alternative ratings separately. Again, I suspect that predicting future games based on these ratings is probably a bit less accurate overall than with the alternative ratings.
Overall Ratings
Home advantage: 2.63 points
Mean score: 26.28 points
Rank Rating Team                  Offense Defense
   1 78.51  Ohio State            37.40   41.16
   2 73.71  Notre Dame            36.52   37.19
   3 72.52  Oregon                39.30   33.13
   4 71.96  Texas                 33.61   38.26
   5 71.91  Ole Miss              37.59   34.32
   6 71.11  Alabama               37.02   33.86
   7 70.59  Indiana               38.10   32.49
   8 69.82  Tennessee             37.12   32.65
   9 69.15  Penn State            32.79   36.37
  10 66.60  Georgia               33.00   33.52
  11 65.38  USC                   36.29   29.17
  12 64.06  South Carolina        30.32   33.77
  13 62.91  BYU                   30.18   32.82
  14 62.61  Louisville            34.61   27.94
  15 62.60  Miami                 38.12   24.60
  16 61.43  Iowa State            29.61   31.90
  17 60.90  LSU                   29.68   31.18
  18 59.77  Texas A&M             30.59   29.26
  19 59.74  Arizona State         30.69   29.04
  20 59.61  Florida               28.31   31.43
Rank Rating Team                  Offense Defense
  21 59.58  SMU                   33.36   26.26
  22 59.31  Minnesota             25.33   33.98
  23 59.16  Missouri              28.36   30.74
  24 58.79  Iowa                  27.18   31.61
  25 58.64  Colorado              28.88   29.74
  26 58.34  Baylor                34.49   23.88
  27 58.19  Clemson               30.17   27.95
  28 58.18  TCU                   30.78   27.37
  29 58.04  Oklahoma              25.96   31.98
  30 57.81  Nebraska              24.88   32.95
  31 57.78  Michigan              23.55   34.20
  32 57.66  Illinois              28.14   29.51
  33 57.36  Auburn                26.47   31.00
  34 57.34  Utah                  25.86   31.69
  35 57.21  Tulane                29.24   27.95
  36 57.19  Vanderbilt            28.81   28.35
  37 56.39  Kansas                29.62   26.66
  38 56.34  Arkansas              28.79   27.62
  39 55.26  Kansas State          28.68   26.60
  40 55.24  Washington            26.25   28.99
Rank Rating Team                  Offense Defense
  41 54.48  Virginia Tech         25.32   29.01
  42 54.47  Georgia Tech          27.64   26.91
  43 54.14  UCF                   29.39   24.77
  44 52.95  Boise State           28.18   24.60
  45 52.86  Boston College        28.30   24.35
  46 52.53  Wisconsin             22.27   30.29
  47 52.17  Texas Tech            34.36   17.60
  48 51.79  Army                  22.42   29.32
  49 51.68  Pittsburgh            29.42   22.27
  50 51.60  Syracuse              29.88   21.62
  51 51.57  Cincinnati            24.36   27.26
  52 51.54  UNLV                  28.43   23.11
  53 51.51  Kentucky              20.99   30.63
  54 51.42  Rutgers               29.18   22.14
  55 50.33  Memphis               27.49   22.62
  56 49.66  Navy                  25.47   24.24
  57 48.58  Maryland              24.76   23.68
  58 47.96  UCLA                  20.72   27.24
  59 47.36  Houston               16.06   31.36
  60 47.08  California            19.04   28.01
Rank Rating Team                  Offense Defense
  61 47.00  Mississippi State     26.01   20.98
  62 46.96  West Virginia         24.96   21.96
  63 46.86  Texas State           28.03   18.88
  64 46.42  James Madison         21.94   24.45
  65 46.31  Florida State         19.89   26.42
  66 46.13  Duke                  22.67   23.52
  67 46.02  Virginia              21.84   24.21
  68 45.99  Old Dominion          23.29   22.59
  69 45.55  South Florida         24.22   21.39
  70 44.90  Michigan State        18.99   25.88
  71 44.66  Ohio                  18.85   25.85
  72 44.64  Washington State      25.48   19.06
  73 44.54  Arizona               21.89   22.65
  74 44.47  North Carolina        24.45   20.05
  75 44.30  UConn                 22.76   21.51
  76 43.74  Marshall              21.26   22.35
  77 43.33  NC State              24.17   19.17
  78 42.61  Northwestern          16.09   26.38
  79 42.52  Jacksonville State    25.16   17.36
  80 42.16  Toledo                21.37   20.93
Rank Rating Team                  Offense Defense
  81 42.16  Oklahoma State        23.99   18.18
  82 41.90  South Alabama         24.05   17.96
  83 41.30  North Texas           26.17   15.13
  84 41.17  East Carolina         21.81   19.31
  85 40.92  UTSA                  25.22   15.56
  86 40.62  Fresno State          20.10   20.54
  87 40.48  Miami (OH)            15.78   24.70
  88 40.35  Louisiana             19.79   20.65
  89 39.60  Northern Illinois     13.23   26.31
  90 39.28  Bowling Green         17.46   21.67
  91 38.72  Western Kentucky      19.63   19.11
  92 38.34  Stanford              18.88   19.55
  93 37.91  Georgia Southern      20.83   17.20
  94 37.39  San José State        19.24   18.08
  95 37.34  Wake Forest           18.35   19.10
  96 36.19  Rice                  15.19   21.08
  97 35.78  Sam Houston           15.99   19.90
  98 35.50  Buffalo               18.91   16.52
  99 34.50  Troy                  17.36   17.15
 100 34.36  Louisiana Tech        11.13   23.32
Rank Rating Team                  Offense Defense
 101 34.35  App State             17.96   16.49
 102 34.27  Utah State            23.87   10.28
 103 34.22  Florida International 15.70   18.44
 104 33.99  Nevada                15.62   18.33
 105 33.95  Liberty               15.61   18.37
 106 33.76  Purdue                17.64   15.98
 107 33.70  Air Force             12.26   21.41
 108 33.67  New Mexico            25.05   8.64
 109 33.40  Oregon State          17.50   15.98
 110 32.89  Wyoming               10.77   22.11
 111 32.57  Colorado State        15.92   16.59
 112 32.23  Western Michigan      19.04   13.13
 113 31.81  Hawai'i               12.82   19.10
 114 31.63  Coastal Carolina      17.43   14.26
 115 31.50  Florida Atlantic      17.61   13.80
 116 30.81  Temple                15.37   15.38
 117 30.49  Arkansas State        18.21   12.28
 118 30.40  UAB                   21.11   9.27
 119 30.32  San Diego State       13.09   17.18
 120 29.94  Georgia State         16.71   13.25
Rank Rating Team                  Offense Defense
 121 29.65  Central Michigan      14.84   14.76
 122 29.62  UL Monroe             13.17   16.44
 123 29.24  Charlotte             14.18   15.04
 124 28.85  Missouri State        19.36   9.44
 125 27.19  Eastern Michigan      14.74   12.38
 126 26.89  Delaware              14.56   12.33
 127 25.58  UTEP                  12.52   13.17
 128 23.66  Akron                 11.30   12.27
 129 22.45  Ball State            15.35   6.98
 130 21.88  Kennesaw State        7.55    14.33
 131 20.46  New Mexico State      9.32    11.11
 132 20.42  Southern Miss         10.07   10.28
 133 19.65  Massachusetts         13.13   6.38
 134 19.57  Tulsa                 12.79   6.80
 135 19.01  Middle Tennessee      10.49   8.59
 136 8.26   Kent State            6.38    1.88
Week 3 Predictions
As always, games are ranked based on the projected quality. This factors in the overall strength of the two teams and the potential for a competitive game. Game quality ratings are not directly comparable between college football and the NFL. NFL games are typically decided by smaller margins than college games, the teams are more balanced in their quality, and there's just not as much scoring in the NFL. Thresholds for close games and blowouts are also different between college and the NFL for the same reasons.
Beside each team, there are two numbers in parentheses. One is the predicted margin of victory (positive) or defeat (negative), the other is the probability of winning. These margins are sometimes larger than what's indicated by the predicted score. That's because there's nothing in the math that prevents a prediction of negative points with a sufficiently lopsided matchup. This is, of course, impossible, so the score is set to zero in those instances. There's no cap on how many points a team can be projected to score, though.
#1: Clemson (1.09, 53.39%) at Georgia Tech (-1.09, 46.61%)
Estimated score: 28.23 - 27.29, Total: 55.52
Quality: 97.09%, Team quality: 95.77%, Competitiveness: 99.81%
Blowout probability (margin >= 30.0 pts): 1.96%
Close game probability (margin <= 7.0 pts): 41.38%
High scoring probability (total >= 66.0 pts): 38.62%
Low scoring probability (total <= 38.0 pts): 31.44%

#2: Florida (-3.92, 37.97%) at LSU (3.92, 62.03%)
Estimated score: 22.09 - 25.84, Total: 47.93
Quality: 96.98%, Team quality: 96.72%, Competitiveness: 97.50%
Blowout probability (margin >= 30.0 pts): 2.50%
Close game probability (margin <= 7.0 pts): 39.79%
High scoring probability (total >= 66.0 pts): 30.90%
Low scoring probability (total <= 38.0 pts): 39.20%

#3: Georgia (-5.85, 32.39%) at Tennessee (5.85, 67.61%)
Estimated score: 25.31 - 31.20, Total: 56.51
Quality: 96.90%, Team quality: 98.12%, Competitiveness: 94.50%
Blowout probability (margin >= 30.0 pts): 3.23%
Close game probability (margin <= 7.0 pts): 37.77%
High scoring probability (total >= 66.0 pts): 39.67%
Low scoring probability (total <= 38.0 pts): 30.47%

#4: Pittsburgh (2.09, 56.47%) at West Virginia (-2.09, 43.53%)
Estimated score: 32.43 - 30.29, Total: 62.72
Quality: 95.35%, Team quality: 93.44%, Competitiveness: 99.29%
Blowout probability (margin >= 30.0 pts): 2.08%
Close game probability (margin <= 7.0 pts): 41.02%
High scoring probability (total >= 66.0 pts): 46.39%
Low scoring probability (total <= 38.0 pts): 24.76%

#5: Washington State (0.71, 52.20%) at North Texas (-0.71, 47.80%)
Estimated score: 35.32 - 34.71, Total: 70.02
Quality: 93.59%, Team quality: 90.58%, Competitiveness: 99.92%
Blowout probability (margin >= 30.0 pts): 1.94%
Close game probability (margin <= 7.0 pts): 41.46%
High scoring probability (total >= 66.0 pts): 54.42%
Low scoring probability (total <= 38.0 pts): 18.84%

#6: Vanderbilt (-9.50, 22.93%) at South Carolina (9.50, 77.07%)
Estimated score: 20.00 - 29.56, Total: 49.56
Quality: 93.00%, Team quality: 96.68%, Competitiveness: 86.04%
Blowout probability (margin >= 30.0 pts): 5.58%
Close game probability (margin <= 7.0 pts): 32.38%
High scoring probability (total >= 66.0 pts): 32.51%
Low scoring probability (total <= 38.0 pts): 37.48%

#7: Colorado (8.65, 75.03%) at Houston (-8.65, 24.97%)
Estimated score: 22.49 - 13.91, Total: 36.40
Quality: 92.45%, Team quality: 94.60%, Competitiveness: 88.30%
Blowout probability (margin >= 30.0 pts): 4.91%
Close game probability (margin <= 7.0 pts): 33.78%
High scoring probability (total >= 66.0 pts): 20.70%
Low scoring probability (total <= 38.0 pts): 51.76%

#8: Jacksonville State (1.98, 56.14%) at Georgia Southern (-1.98, 43.86%)
Estimated score: 32.93 - 31.07, Total: 64.00
Quality: 92.38%, Team quality: 89.07%, Competitiveness: 99.36%
Blowout probability (margin >= 30.0 pts): 2.07%
Close game probability (margin <= 7.0 pts): 41.07%
High scoring probability (total >= 66.0 pts): 47.80%
Low scoring probability (total <= 38.0 pts): 23.65%

#9: Kansas State (8.09, 73.61%) at Arizona (-8.09, 26.39%)
Estimated score: 30.99 - 22.88, Total: 53.88
Quality: 92.23%, Team quality: 93.51%, Competitiveness: 89.70%
Blowout probability (margin >= 30.0 pts): 4.51%
Close game probability (margin <= 7.0 pts): 34.66%
High scoring probability (total >= 66.0 pts): 36.90%
Low scoring probability (total <= 38.0 pts): 33.06%

#10: NC State (3.36, 60.34%) at Wake Forest (-3.36, 39.66%)
Estimated score: 30.03 - 26.78, Total: 56.82
Quality: 92.04%, Team quality: 89.12%, Competitiveness: 98.16%
Blowout probability (margin >= 30.0 pts): 2.34%
Close game probability (margin <= 7.0 pts): 40.24%
High scoring probability (total >= 66.0 pts): 40.00%
Low scoring probability (total <= 38.0 pts): 30.18%

#11: Minnesota (9.60, 77.31%) at California (-9.60, 22.69%)
Estimated score: 22.29 - 12.65, Total: 34.94
Quality: 91.58%, Team quality: 94.63%, Competitiveness: 85.76%
Blowout probability (margin >= 30.0 pts): 5.66%
Close game probability (margin <= 7.0 pts): 32.21%
High scoring probability (total >= 66.0 pts): 19.57%
Low scoring probability (total <= 38.0 pts): 53.36%

#12: Air Force (-3.20, 40.14%) at Utah State (3.20, 59.86%)
Estimated score: 26.95 - 30.05, Total: 57.00
Quality: 89.27%, Team quality: 85.06%, Competitiveness: 98.33%
Blowout probability (margin >= 30.0 pts): 2.30%
Close game probability (margin <= 7.0 pts): 40.36%
High scoring probability (total >= 66.0 pts): 40.19%
Low scoring probability (total <= 38.0 pts): 30.00%

#13: Old Dominion (-11.11, 19.29%) at Virginia Tech (11.11, 80.71%)
Estimated score: 19.25 - 30.33, Total: 49.58
Quality: 89.24%, Team quality: 93.50%, Competitiveness: 81.30%
Blowout probability (margin >= 30.0 pts): 7.09%
Close game probability (margin <= 7.0 pts): 29.54%
High scoring probability (total >= 66.0 pts): 32.52%
Low scoring probability (total <= 38.0 pts): 37.47%

#14: East Carolina (6.91, 70.51%) at Coastal Carolina (-6.91, 29.49%)
Estimated score: 32.53 - 25.71, Total: 58.24
Quality: 88.48%, Team quality: 86.58%, Competitiveness: 92.41%
Blowout probability (margin >= 30.0 pts): 3.77%
Close game probability (margin <= 7.0 pts): 36.40%
High scoring probability (total >= 66.0 pts): 41.52%
Low scoring probability (total <= 38.0 pts): 28.83%

#15: Liberty (-7.96, 26.73%) at Bowling Green (7.96, 73.27%)
Estimated score: 18.90 - 26.69, Total: 45.59
Quality: 87.77%, Team quality: 86.67%, Competitiveness: 90.03%
Blowout probability (margin >= 30.0 pts): 4.42%
Close game probability (margin <= 7.0 pts): 34.87%
High scoring probability (total >= 66.0 pts): 28.66%
Low scoring probability (total <= 38.0 pts): 41.71%

#16: Florida Atlantic (-5.35, 33.83%) at Florida International (5.35, 66.17%)
Estimated score: 24.14 - 29.49, Total: 53.63
Quality: 87.76%, Team quality: 84.18%, Competitiveness: 95.40%
Blowout probability (margin >= 30.0 pts): 3.01%
Close game probability (margin <= 7.0 pts): 38.37%
High scoring probability (total >= 66.0 pts): 36.65%
Low scoring probability (total <= 38.0 pts): 33.31%

#17: Boston College (11.89, 82.33%) at Stanford (-11.89, 17.67%)
Estimated score: 33.72 - 22.13, Total: 55.85
Quality: 87.06%, Team quality: 91.48%, Competitiveness: 78.85%
Blowout probability (margin >= 30.0 pts): 7.93%
Close game probability (margin <= 7.0 pts): 28.12%
High scoring probability (total >= 66.0 pts): 38.97%
Low scoring probability (total <= 38.0 pts): 31.11%

#18: Duke (-13.71, 14.23%) at Tulane (13.71, 85.77%)
Estimated score: 19.69 - 33.31, Total: 53.00
Quality: 86.23%, Team quality: 93.89%, Competitiveness: 72.74%
Blowout probability (margin >= 30.0 pts): 10.21%
Close game probability (margin <= 7.0 pts): 24.73%
High scoring probability (total >= 66.0 pts): 35.99%
Low scoring probability (total <= 38.0 pts): 33.95%

#19: Memphis (13.20, 84.85%) at Troy (-13.20, 15.15%)
Estimated score: 35.31 - 22.33, Total: 57.64
Quality: 84.36%, Team quality: 89.78%, Competitiveness: 74.49%
Blowout probability (margin >= 30.0 pts): 9.53%
Close game probability (margin <= 7.0 pts): 25.68%
High scoring probability (total >= 66.0 pts): 40.87%
Low scoring probability (total <= 38.0 pts): 29.39%

#20: Texas A&M (-16.57, 9.79%) at Notre Dame (16.57, 90.21%)
Estimated score: 18.36 - 34.86, Total: 53.22
Quality: 84.09%, Team quality: 97.61%, Competitiveness: 62.41%
Blowout probability (margin >= 30.0 pts): 14.75%
Close game probability (margin <= 7.0 pts): 19.46%
High scoring probability (total >= 66.0 pts): 36.21%
Low scoring probability (total <= 38.0 pts): 33.73%

#21: Texas State (-15.51, 11.30%) at Arizona State (15.51, 88.70%)
Estimated score: 23.97 - 39.40, Total: 63.37
Quality: 83.88%, Team quality: 94.35%, Competitiveness: 66.31%
Blowout probability (margin >= 30.0 pts): 12.92%
Close game probability (margin <= 7.0 pts): 21.38%
High scoring probability (total >= 66.0 pts): 47.11%
Low scoring probability (total <= 38.0 pts): 24.19%

#22: New Hampshire (-3.27, 39.92%) at Ball State (3.27, 60.08%)
Estimated score: 24.41 - 27.48, Total: 51.89
Quality: 82.10%, Team quality: 75.05%, Competitiveness: 98.26%
Blowout probability (margin >= 30.0 pts): 2.32%
Close game probability (margin <= 7.0 pts): 40.31%
High scoring probability (total >= 66.0 pts): 34.85%
Low scoring probability (total <= 38.0 pts): 35.07%

#23: Monmouth (-8.47, 25.43%) at Charlotte (8.47, 74.57%)
Estimated score: 32.82 - 41.16, Total: 73.98
Quality: 81.92%, Team quality: 78.70%, Competitiveness: 88.77%
Blowout probability (margin >= 30.0 pts): 4.78%
Close game probability (margin <= 7.0 pts): 34.07%
High scoring probability (total >= 66.0 pts): 58.71%
Low scoring probability (total <= 38.0 pts): 16.04%

#24: Akron (-9.37, 23.23%) at UAB (9.37, 76.77%)
Estimated score: 27.00 - 36.43, Total: 63.43
Quality: 81.57%, Team quality: 79.26%, Competitiveness: 86.40%
Blowout probability (margin >= 30.0 pts): 5.47%
Close game probability (margin <= 7.0 pts): 32.60%
High scoring probability (total >= 66.0 pts): 47.17%
Low scoring probability (total <= 38.0 pts): 24.14%

#25: Arkansas (-18.20, 7.77%) at Ole Miss (18.20, 92.23%)
Estimated score: 19.44 - 37.57, Total: 57.01
Quality: 80.98%, Team quality: 97.06%, Competitiveness: 56.37%
Blowout probability (margin >= 30.0 pts): 17.87%
Close game probability (margin <= 7.0 pts): 16.64%
High scoring probability (total >= 66.0 pts): 40.21%
Low scoring probability (total <= 38.0 pts): 29.99%

#26: App State (11.30, 81.11%) at Southern Miss (-11.30, 18.89%)
Estimated score: 32.65 - 21.17, Total: 53.82
Quality: 79.84%, Team quality: 79.41%, Competitiveness: 80.71%
Blowout probability (margin >= 30.0 pts): 7.29%
Close game probability (margin <= 7.0 pts): 29.20%
High scoring probability (total >= 66.0 pts): 36.84%
Low scoring probability (total <= 38.0 pts): 33.12%

#27: UConn (14.78, 87.57%) at Delaware (-14.78, 12.43%)
Estimated score: 35.39 - 20.64, Total: 56.03
Quality: 79.55%, Team quality: 85.45%, Competitiveness: 68.94%
Blowout probability (margin >= 30.0 pts): 11.77%
Close game probability (margin <= 7.0 pts): 22.72%
High scoring probability (total >= 66.0 pts): 39.16%
Low scoring probability (total <= 38.0 pts): 30.94%

#28: Incarnate Word (-15.03, 12.05%) at UTSA (15.03, 87.95%)
Estimated score: 26.30 - 41.16, Total: 67.46
Quality: 78.82%, Team quality: 84.82%, Competitiveness: 68.07%
Blowout probability (margin >= 30.0 pts): 12.15%
Close game probability (margin <= 7.0 pts): 22.27%
High scoring probability (total >= 66.0 pts): 51.61%
Low scoring probability (total <= 38.0 pts): 20.81%

#29: South Alabama (-18.10, 7.89%) at Auburn (18.10, 92.11%)
Estimated score: 18.02 - 36.11, Total: 54.14
Quality: 78.76%, Team quality: 92.77%, Competitiveness: 56.76%
Blowout probability (margin >= 30.0 pts): 17.65%
Close game probability (margin <= 7.0 pts): 16.82%
High scoring probability (total >= 66.0 pts): 37.17%
Low scoring probability (total <= 38.0 pts): 32.81%

#30: New Mexico (-16.92, 9.33%) at UCLA (16.92, 90.67%)
Estimated score: 22.78 - 39.68, Total: 62.46
Quality: 78.25%, Team quality: 88.54%, Competitiveness: 61.12%
Blowout probability (margin >= 30.0 pts): 15.38%
Close game probability (margin <= 7.0 pts): 18.84%
High scoring probability (total >= 66.0 pts): 46.11%
Low scoring probability (total <= 38.0 pts): 24.98%

#31: South Florida (-19.68, 6.23%) at Miami (19.68, 93.77%)
Estimated score: 24.59 - 44.33, Total: 68.92
Quality: 76.78%, Team quality: 94.30%, Competitiveness: 50.89%
Blowout probability (margin >= 30.0 pts): 21.04%
Close game probability (margin <= 7.0 pts): 14.25%
High scoring probability (total >= 66.0 pts): 53.21%
Low scoring probability (total <= 38.0 pts): 19.67%

#32: Wisconsin (-21.20, 4.90%) at Alabama (21.20, 95.10%)
Estimated score: 13.38 - 34.33, Total: 47.71
Quality: 74.98%, Team quality: 96.39%, Competitiveness: 45.38%
Blowout probability (margin >= 30.0 pts): 24.62%
Close game probability (margin <= 7.0 pts): 12.00%
High scoring probability (total >= 66.0 pts): 30.68%
Low scoring probability (total <= 38.0 pts): 39.44%

#33: New Mexico State (-16.53, 9.85%) at Louisiana Tech (16.53, 90.15%)
Estimated score: 10.97 - 27.62, Total: 38.59
Quality: 73.02%, Team quality: 78.87%, Competitiveness: 62.57%
Blowout probability (margin >= 30.0 pts): 14.67%
Close game probability (margin <= 7.0 pts): 19.54%
High scoring probability (total >= 66.0 pts): 22.47%
Low scoring probability (total <= 38.0 pts): 49.35%

#34: Merrimack (-11.70, 18.07%) at Kennesaw State (11.70, 81.93%)
Estimated score: 13.76 - 25.49, Total: 39.25
Quality: 72.79%, Team quality: 69.66%, Competitiveness: 79.47%
Blowout probability (margin >= 30.0 pts): 7.71%
Close game probability (margin <= 7.0 pts): 28.47%
High scoring probability (total >= 66.0 pts): 23.02%
Low scoring probability (total <= 38.0 pts): 48.63%

#35: Louisiana (-21.44, 4.72%) at Missouri (21.44, 95.28%)
Estimated score: 14.01 - 35.31, Total: 49.32
Quality: 72.51%, Team quality: 92.50%, Competitiveness: 44.55%
Blowout probability (margin >= 30.0 pts): 25.20%
Close game probability (margin <= 7.0 pts): 11.67%
High scoring probability (total >= 66.0 pts): 32.26%
Low scoring probability (total <= 38.0 pts): 37.74%

#36: Middle Tennessee (-17.62, 8.46%) at Nevada (17.62, 91.54%)
Estimated score: 17.13 - 34.63, Total: 51.76
Quality: 70.84%, Team quality: 77.93%, Competitiveness: 58.54%
Blowout probability (margin >= 30.0 pts): 16.70%
Close game probability (margin <= 7.0 pts): 17.63%
High scoring probability (total >= 66.0 pts): 34.72%
Low scoring probability (total <= 38.0 pts): 35.21%

#37: Oregon State (-21.39, 4.75%) at Texas Tech (21.39, 95.25%)
Estimated score: 24.87 - 45.98, Total: 70.85
Quality: 70.82%, Team quality: 89.14%, Competitiveness: 44.70%
Blowout probability (margin >= 30.0 pts): 25.09%
Close game probability (margin <= 7.0 pts): 11.73%
High scoring probability (total >= 66.0 pts): 55.32%
Low scoring probability (total <= 38.0 pts): 18.23%

#38: Utah (21.81, 95.57%) at Wyoming (-21.81, 4.43%)
Estimated score: 28.72 - 6.68, Total: 35.39
Quality: 70.64%, Team quality: 90.32%, Competitiveness: 43.21%
Blowout probability (margin >= 30.0 pts): 26.15%
Close game probability (margin <= 7.0 pts): 11.15%
High scoring probability (total >= 66.0 pts): 19.92%
Low scoring probability (total <= 38.0 pts): 52.87%

#39: Portland State (-19.84, 6.08%) at Hawai'i (19.84, 93.92%)
Estimated score: 17.14 - 37.10, Total: 54.25
Quality: 65.39%, Team quality: 74.55%, Competitiveness: 50.32%
Blowout probability (margin >= 30.0 pts): 21.39%
Close game probability (margin <= 7.0 pts): 14.01%
High scoring probability (total >= 66.0 pts): 37.29%
Low scoring probability (total <= 38.0 pts): 32.69%

#40: Richmond (-22.83, 3.74%) at North Carolina (22.83, 96.26%)
Estimated score: 12.83 - 35.79, Total: 48.62
Quality: 65.19%, Team quality: 83.54%, Competitiveness: 39.69%
Blowout probability (margin >= 30.0 pts): 28.79%
Close game probability (margin <= 7.0 pts): 9.84%
High scoring probability (total >= 66.0 pts): 31.58%
Low scoring probability (total <= 38.0 pts): 38.47%

#41: Oklahoma (24.60, 97.26%) at Temple (-24.60, 2.74%)
Estimated score: 35.55 - 10.98, Total: 46.53
Quality: 64.77%, Team quality: 89.60%, Competitiveness: 33.84%
Blowout probability (margin >= 30.0 pts): 33.67%
Close game probability (margin <= 7.0 pts): 7.80%
High scoring probability (total >= 66.0 pts): 29.55%
Low scoring probability (total <= 38.0 pts): 40.69%

#42: Oregon (27.27, 98.33%) at Northwestern (-27.27, 1.67%)
Estimated score: 37.89 - 10.55, Total: 48.44
Quality: 61.48%, Team quality: 94.73%, Competitiveness: 25.89%
Blowout probability (margin >= 30.0 pts): 41.57%
Close game probability (margin <= 7.0 pts): 5.31%
High scoring probability (total >= 66.0 pts): 31.40%
Low scoring probability (total <= 38.0 pts): 38.66%

#43: Eastern Kentucky (-24.42, 2.84%) at Marshall (24.42, 97.16%)
Estimated score: 10.19 - 34.56, Total: 44.76
Quality: 61.47%, Team quality: 82.13%, Competitiveness: 34.43%
Blowout probability (margin >= 30.0 pts): 33.15%
Close game probability (margin <= 7.0 pts): 7.99%
High scoring probability (total >= 66.0 pts): 27.88%
Low scoring probability (total <= 38.0 pts): 42.60%

#44: Eastern Michigan (-26.95, 1.77%) at Kentucky (26.95, 98.23%)
Estimated score: 9.08 - 36.21, Total: 45.28
Quality: 58.43%, Team quality: 86.28%, Competitiveness: 26.79%
Blowout probability (margin >= 30.0 pts): 40.58%
Close game probability (margin <= 7.0 pts): 5.57%
High scoring probability (total >= 66.0 pts): 28.38%
Low scoring probability (total <= 38.0 pts): 42.03%

#45: Western Michigan (-28.06, 1.43%) at Illinois (28.06, 98.57%)
Estimated score: 14.50 - 42.61, Total: 57.11
Quality: 57.47%, Team quality: 89.37%, Competitiveness: 23.76%
Blowout probability (margin >= 30.0 pts): 43.98%
Close game probability (margin <= 7.0 pts): 4.70%
High scoring probability (total >= 66.0 pts): 40.31%
Low scoring probability (total <= 38.0 pts): 29.90%

#46: SMU (28.10, 98.58%) at Missouri State (-28.10, 1.42%)
Estimated score: 48.89 - 20.70, Total: 69.59
Quality: 57.22%, Team quality: 88.97%, Competitiveness: 23.66%
Blowout probability (margin >= 30.0 pts): 44.10%
Close game probability (margin <= 7.0 pts): 4.67%
High scoring probability (total >= 66.0 pts): 53.94%
Low scoring probability (total <= 38.0 pts): 19.17%

#47: Iowa State (28.31, 98.64%) at Arkansas State (-28.31, 1.36%)
Estimated score: 42.30 - 13.91, Total: 56.20
Quality: 57.16%, Team quality: 89.86%, Competitiveness: 23.13%
Blowout probability (margin >= 30.0 pts): 44.74%
Close game probability (margin <= 7.0 pts): 4.52%
High scoring probability (total >= 66.0 pts): 39.34%
Low scoring probability (total <= 38.0 pts): 30.77%

#48: USC (29.00, 98.82%) at Purdue (-29.00, 1.18%)
Estimated score: 45.27 - 16.07, Total: 61.34
Quality: 56.36%, Team quality: 91.50%, Competitiveness: 21.38%
Blowout probability (margin >= 30.0 pts): 46.89%
Close game probability (margin <= 7.0 pts): 4.05%
High scoring probability (total >= 66.0 pts): 44.88%
Low scoring probability (total <= 38.0 pts): 25.97%

#49: Buffalo (24.61, 97.26%) at Kent State (-24.61, 2.74%)
Estimated score: 42.00 - 17.45, Total: 59.45
Quality: 56.18%, Team quality: 72.42%, Competitiveness: 33.81%
Blowout probability (margin >= 30.0 pts): 33.70%
Close game probability (margin <= 7.0 pts): 7.78%
High scoring probability (total >= 66.0 pts): 42.83%
Low scoring probability (total <= 38.0 pts): 27.69%

#50: Navy (27.46, 98.39%) at Tulsa (-27.46, 1.61%)
Estimated score: 43.64 - 16.14, Total: 59.78
Quality: 55.88%, Team quality: 82.91%, Competitiveness: 25.38%
Blowout probability (margin >= 30.0 pts): 42.13%
Close game probability (margin <= 7.0 pts): 5.16%
High scoring probability (total >= 66.0 pts): 43.18%
Low scoring probability (total <= 38.0 pts): 27.39%

#51: Towson (-28.82, 1.22%) at Maryland (28.82, 98.78%)
Estimated score: 10.71 - 39.38, Total: 50.09
Quality: 53.30%, Team quality: 83.29%, Competitiveness: 21.82%
Blowout probability (margin >= 30.0 pts): 46.33%
Close game probability (margin <= 7.0 pts): 4.17%
High scoring probability (total >= 66.0 pts): 33.03%
Low scoring probability (total <= 38.0 pts): 36.93%

#52: Youngstown State (-28.86, 1.21%) at Michigan State (28.86, 98.79%)
Estimated score: 13.65 - 42.61, Total: 56.27
Quality: 52.00%, Team quality: 80.45%, Competitiveness: 21.73%
Blowout probability (margin >= 30.0 pts): 46.45%
Close game probability (margin <= 7.0 pts): 4.14%
High scoring probability (total >= 66.0 pts): 39.41%
Low scoring probability (total <= 38.0 pts): 30.71%

#53: Central Michigan (-30.76, 0.82%) at Michigan (30.76, 99.18%)
Estimated score: 5.60 - 36.38, Total: 41.99
Quality: 51.29%, Team quality: 88.25%, Competitiveness: 17.33%
Blowout probability (margin >= 30.0 pts): 52.37%
Close game probability (margin <= 7.0 pts): 3.02%
High scoring probability (total >= 66.0 pts): 25.38%
Low scoring probability (total <= 38.0 pts): 45.62%

#54: William & Mary (-30.50, 0.87%) at Virginia (30.50, 99.13%)
Estimated score: 9.97 - 40.57, Total: 50.54
Quality: 48.71%, Team quality: 80.35%, Competitiveness: 17.90%
Blowout probability (margin >= 30.0 pts): 51.54%
Close game probability (margin <= 7.0 pts): 3.16%
High scoring probability (total >= 66.0 pts): 33.48%
Low scoring probability (total <= 38.0 pts): 36.46%

#55: Abilene Christian (-33.90, 0.41%) at TCU (33.90, 99.59%)
Estimated score: 15.30 - 49.14, Total: 64.44
Quality: 44.28%, Team quality: 86.98%, Competitiveness: 11.48%
Blowout probability (margin >= 30.0 pts): 61.95%
Close game probability (margin <= 7.0 pts): 1.72%
High scoring probability (total >= 66.0 pts): 48.28%
Low scoring probability (total <= 38.0 pts): 23.28%

#56: Murray State (-30.77, 0.82%) at Georgia State (30.77, 99.18%)
Estimated score: 18.31 - 49.26, Total: 67.57
Quality: 41.74%, Team quality: 64.83%, Competitiveness: 17.31%
Blowout probability (margin >= 30.0 pts): 52.40%
Close game probability (margin <= 7.0 pts): 3.02%
High scoring probability (total >= 66.0 pts): 51.73%
Low scoring probability (total <= 38.0 pts): 20.72%

#57: Ohio (-36.49, 0.22%) at Ohio State (36.49, 99.78%)
Estimated score: 2.66 - 39.15, Total: 41.81
Quality: 41.38%, Team quality: 94.93%, Competitiveness: 7.86%
Blowout probability (margin >= 30.0 pts): 69.37%
Close game probability (margin <= 7.0 pts): 1.03%
High scoring probability (total >= 66.0 pts): 25.22%
Low scoring probability (total <= 38.0 pts): 45.82%

#58: Morgan State (-34.36, 0.37%) at Toledo (34.36, 99.63%)
Estimated score: 7.06 - 41.43, Total: 48.50
Quality: 39.07%, Team quality: 74.44%, Competitiveness: 10.76%
Blowout probability (margin >= 30.0 pts): 63.31%
Close game probability (margin <= 7.0 pts): 1.58%
High scoring probability (total >= 66.0 pts): 31.45%
Low scoring probability (total <= 38.0 pts): 38.60%

#59: Prairie View A&M (-38.33, 0.14%) at Rice (38.33, 99.86%)
Estimated score: 2.24 - 40.65, Total: 42.89
Quality: 29.33%, Team quality: 65.47%, Competitiveness: 5.89%
Blowout probability (margin >= 30.0 pts): 74.21%
Close game probability (margin <= 7.0 pts): 0.70%
High scoring probability (total >= 66.0 pts): 26.18%
Low scoring probability (total <= 38.0 pts): 44.63%

#60: Massachusetts (-41.77, 0.06%) at Iowa (41.77, 99.94%)
Estimated score: 6.48 - 48.40, Total: 54.88
Quality: 28.23%, Team quality: 83.03%, Competitiveness: 3.26%
Blowout probability (margin >= 30.0 pts): 82.09%
Close game probability (margin <= 7.0 pts): 0.33%
High scoring probability (total >= 66.0 pts): 37.95%
Low scoring probability (total <= 38.0 pts): 32.07%

#61: Southern (-42.36, 0.05%) at Fresno State (42.36, 99.95%)
Estimated score: 1.82 - 44.22, Total: 46.04
Quality: 23.55%, Team quality: 66.75%, Competitiveness: 2.93%
Blowout probability (margin >= 30.0 pts): 83.26%
Close game probability (margin <= 7.0 pts): 0.28%
High scoring probability (total >= 66.0 pts): 29.09%
Low scoring probability (total <= 38.0 pts): 41.22%

#62: Villanova (-48.63, 0.01%) at Penn State (48.63, 99.99%)
Estimated score: 0.00 - 41.78, Total: 41.78
Quality: 18.29%, Team quality: 85.82%, Competitiveness: 0.83%
Blowout probability (margin >= 30.0 pts): 92.70%
Close game probability (margin <= 7.0 pts): 0.06%
High scoring probability (total >= 66.0 pts): 25.19%
Low scoring probability (total <= 38.0 pts): 45.85%

#63: Colgate (-47.39, 0.01%) at Syracuse (47.39, 99.99%)
Estimated score: 7.61 - 54.88, Total: 62.49
Quality: 18.00%, Team quality: 73.31%, Competitiveness: 1.09%
Blowout probability (margin >= 30.0 pts): 91.26%
Close game probability (margin <= 7.0 pts): 0.08%
High scoring probability (total >= 66.0 pts): 46.14%
Low scoring probability (total <= 38.0 pts): 24.95%

#64: UTEP (-49.01, 0.01%) at Texas (49.01, 99.99%)
Estimated score: 0.00 - 48.04, Total: 48.04
Quality: 18.00%, Team quality: 87.27%, Competitiveness: 0.77%
Blowout probability (margin >= 30.0 pts): 93.10%
Close game probability (margin <= 7.0 pts): 0.05%
High scoring probability (total >= 66.0 pts): 31.01%
Low scoring probability (total <= 38.0 pts): 39.08%

#65: Samford (-48.05, 0.01%) at Baylor (48.05, 99.99%)
Estimated score: 5.26 - 53.07, Total: 58.33
Quality: 17.99%, Team quality: 78.56%, Competitiveness: 0.94%
Blowout probability (margin >= 30.0 pts): 92.05%
Close game probability (margin <= 7.0 pts): 0.07%
High scoring probability (total >= 66.0 pts): 41.62%
Low scoring probability (total <= 38.0 pts): 28.74%

#66: Norfolk State (-48.91, 0.01%) at Rutgers (48.91, 99.99%)
Estimated score: 4.70 - 53.43, Total: 58.13
Quality: 15.94%, Team quality: 71.95%, Competitiveness: 0.78%
Blowout probability (margin >= 30.0 pts): 93.00%
Close game probability (margin <= 7.0 pts): 0.05%
High scoring probability (total >= 66.0 pts): 41.40%
Low scoring probability (total <= 38.0 pts): 28.93%

#67: Alcorn State (-49.24, 0.01%) at Mississippi State (49.24, 99.99%)
Estimated score: 1.58 - 50.77, Total: 52.34
Quality: 14.90%, Team quality: 67.44%, Competitiveness: 0.73%
Blowout probability (margin >= 30.0 pts): 93.34%
Close game probability (margin <= 7.0 pts): 0.05%
High scoring probability (total >= 66.0 pts): 35.31%
Low scoring probability (total <= 38.0 pts): 34.61%

#68: Houston Christian (-50.38, 0.00%) at Nebraska (50.38, 100.00%)
Estimated score: 0.00 - 49.36, Total: 49.36
Quality: 14.87%, Team quality: 76.44%, Competitiveness: 0.56%
Blowout probability (margin >= 30.0 pts): 94.41%
Close game probability (margin <= 7.0 pts): 0.04%
High scoring probability (total >= 66.0 pts): 32.30%
Low scoring probability (total <= 38.0 pts): 37.69%

#69: Indiana State (-63.40, 0.00%) at Indiana (63.40, 100.00%)
Estimated score: 0.00 - 60.23, Total: 60.23
Quality: 4.75%, Team quality: 77.10%, Competitiveness: 0.02%
Blowout probability (margin >= 30.0 pts): 99.54%
Close game probability (margin <= 7.0 pts): 0.00%
High scoring probability (total >= 66.0 pts): 43.67%
Low scoring probability (total <= 38.0 pts): 26.98%

#70: Northwestern State (-67.24, 0.00%) at Cincinnati (67.24, 100.00%)
Estimated score: 0.00 - 60.65, Total: 60.65
Quality: 2.57%, Team quality: 55.93%, Competitiveness: 0.01%
Blowout probability (margin >= 30.0 pts): 99.82%
Close game probability (margin <= 7.0 pts): 0.00%
High scoring probability (total >= 66.0 pts): 44.13%
Low scoring probability (total <= 38.0 pts): 26.60%
I'll post some more data later today, including the alternative ratings and their game predictions for week 3 of the college football season, then NFL ratings after week 1 and updated simulations of the season.
Thanks for reading!
The computer ratings in this article are based on data from collegefootballdata.com.