


2023 MLB Team Defensive Ratings
A look at which teams benefited the most from good pitching and defense


Before I resume my 2024 season preview, I'm going to take a brief detour and revisit team defense from the 2023 season. Although this isn't part of my predictions for the upcoming season, these ratings do provide some guidance about where teams have the most room for improvement in 2024. If you’re interested in reading more articles like this, please consider subscribing.
Defensive skill is considerably more challenging to quantify than offense or pitching. Many of the best approaches like Defensive Runs Saved and Ultimate Zone Rating are based on the degree of difficulty in fielding each batted ball, limiting the advance of baserunners, and recording outs. I took a different and somewhat simpler approach, instead estimating how many runs a team's pitchers would be expected to allow, then comparing that to the actual number of runs a team allowed as a measure of defensive skill.
Fielding Independent Pitching
The first step to explain how this works is the equation for Fielding Independent Pitching (FIP), which predicts what a pitcher's ERA would be with a league average defense:

The equation consists of two parts, the first of which is an estimate of how well a pitcher saves or allows runs based on the three (or four) true outcomes: home runs, walks, hit batters, and strikeouts. The second component is a league constant so that FIP and ERA would be identical if a pitcher had league average rates for the three true outcomes. The pitcher has a lot of control over events in the first component of the equation, but has considerably less influence on what happens when the ball is put into play. There are, however, a couple of ways that a pitcher can still affect how many runs they allow from balls in play:
A pitcher who allows fewer balls to be put in play is less reliant on the team's defense.
A pitcher can have some impact on exit velocity and launch angle. For example, a pitcher who induces a lot of weak ground balls is likely to give up fewer runs than one who allows a lot of hard-hit line drives.
The first part is easy to calculate: what percentage of plate appearances against a pitcher resulted in one of the three true outcomes? The second is a bit more complex, especially because fly balls are more readily converted into outs than ground balls or line drives, but fly balls also result in a disproportionate amount of extra base hits. Excluding home runs and bunts, here are the batting average, slugging percentage, and total bases per hit, averaged over the 2023 season:
Line drives: .638 BA, .853 SLG, 1.337 bases per hit
Fly balls: .098 BA, .159 SLG, 1.623 bases per hit
Ground balls: .244 BA, .269 SLG, 1.104 bases per hit
I excluded home runs from this because their impact is captured in the first piece of the FIP equation. A fly ball pitcher will generally allow fewer runners than a ground ball pitcher, but this comes at the expense of more extra base hits. The real value of fly balls is that they produce the large majority of home runs; however, ground balls are almost certainly more valuable for balls in play.
Pitching and Defensive Efficiency
Defensive efficiency is a measure of how readily a defense converts balls in play into outs. Here is the equation for defensive efficiency, where ROE is the number of times a runner reached base on an error:
Using 2023 park-adjusted totals for all 30 teams, I calculated the correlation coefficient between five different variables and a team's defensive efficiency. These variables, average exit velocity, percentage of hard-hit balls, line drive rate, fly ball rate, and ground ball rate, were selected because the defense has no impact on any of them.
Hard Hit%: r: -0.286, p-value: 0.125
Exit velocity: r: -0.213, p-value: 0.257
Ground Ball%: r: 0.056, p-value: 0.769
Line Drive%: r: -0.318, p-value: 0.086
Fly Ball%: r: 0.022, p-value: 0.907
All Variables%: r: 0.394, p-value: 0.031
These results are somewhat intuitive, even if the statistical significance is limited. Hard hit balls and line drives are harder for defenses to convert into outs, so they lower defensive efficiency. In 2023, at least 39.4% of the variance in a team's defensive efficiency could be explained by things that a pitcher can influence, but that the defense has no control over. This shows that a pitcher actually does have some control over what happens even after the ball is put in play.
Pitching and Runs on Balls in Play
The runs a pitcher allows because of balls in play can be estimated by taking the average number of runs a pitcher allows per nine innings (total runs) and subtracting the first component of the FIP equation (runs due to balls not put in play). Using that as the dependent variable, I ran another series of linear regressions. This time, I added in two new independent variables: 1) the pitcher's impact on defensive efficiency, and 2) the percentage of plate appearances that end in one of the three true outcomes.
Defensive efficiency due to the pitcher: r: -0.200, p-value: 0.290
Three true outcome rate: r: -0.112, p-value: 0.554
Hard Hit%: r: 0.114, p-value: 0.550
Exit velocity: r: 0.122, p-value: 0.522
Ground Ball%: r: -0.085, p-value: 0.655
Line Drive%: r: 0.248, p-value: 0.187
Fly Ball%: r: -0.018, p-value: 0.925
All variables: r: 0.293, p-value: 0.117
Again, statistical significance is low, though this is somewhat due to only having 30 teams in the data set. The correlations were also unusually weak compared to other recent seasons. These correlations use aggregated data for each team's entire pitching staff, but some individual pitchers do exert considerably more control over what happens when balls are put in play. The biggest factors are that 1) making it easier for the defense to convert balls in play into outs suppresses runs, and 2) more line drives tends to result in more runs allowed.
Team Defensive Ratings
Although the correlation in the statistical model is weak, adding its predictions (runs due to balls in play) to the first component of the FIP equation (runs due to the three true outcomes) gives an estimate of how many runs a team would allow with an average defense. The team's defensive skill is then the difference between this estimate and the actual number of runs the team allowed. Win estimates are based on updating a team’s runs allowed based on those estimates, then calculating the team’s Pythagorean winning percentage. Positive runs allowed and negative wins means that a team was worse than a league average pitching staff or defense.
Using this approach, here are the defensive ratings for each team during the 2023 season:
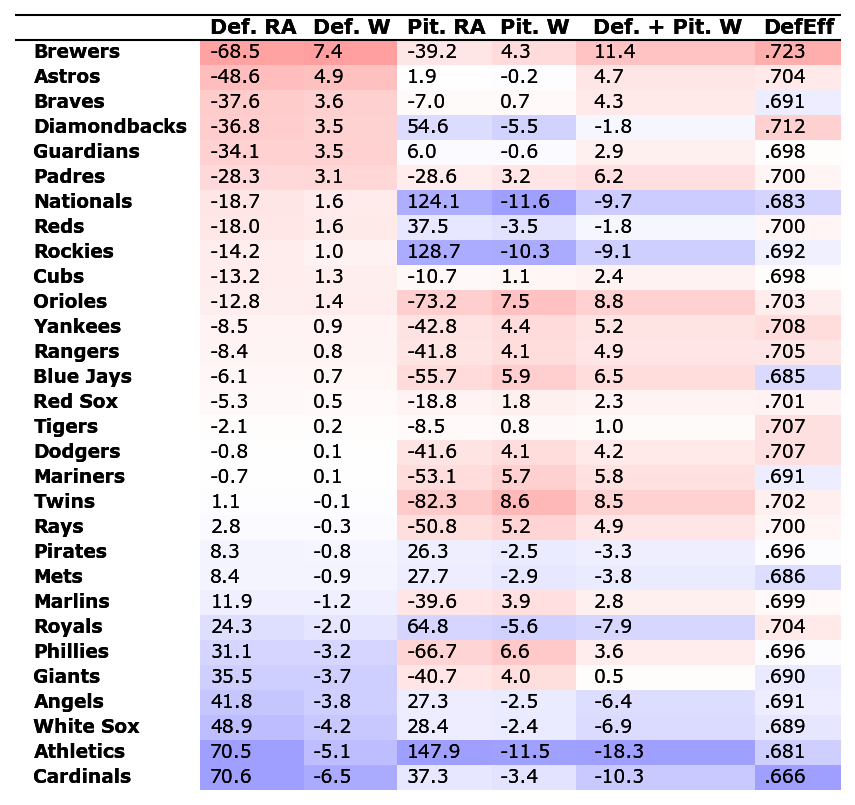
For many teams, these defensive ratings are roughly in agreement with other metrics such as defensive runs saved. Some of the differences probably arise partly because of how I partition runs allowed between the pitching and defense. The 2023 Cardinals had atrocious pitching statistics, but the pitching staff appeared worse than it really was due to playing some of the worst defense in all of baseball. Improved defense in 2024 will probably do more to put the Cardinals back in contention for a playoff spot than the overhaul of their pitching rotation. A team like the Diamondbacks would actually have more to gain from improved pitching if they intend on contending in 2024. The Brewers traded away Corbin Burnes during the offseason, and while this certainly diminishes the quality of their pitching staff, the impact of this move is likely mitigated by their defensive skill. Although Dylan Cease was the staff ace for the White Sox, he is expected to benefit from a much better defensive play after being dealt to the Padres.
I intend to revisit this topic again after opening day, perhaps with a look at how individual pitchers are able to help or hinder the ability of the defense to record outs and limit runs. If you would like to support future articles, please consider subscribing. I plan to enable paid subscriptions in the next couple of weeks, and contributing in this manner will help me to continue writing in-depth articles like this one.
The data used in this work is sourced from Baseball Reference, Fangraphs, and Retrosheet.